Download
1 / 13
130 likes | 165 Views
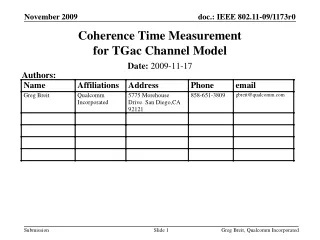
Measured Channel Variation and Coherence Time in NTT Lab. Date: 2010-1-18. Authors:. Introduction. Channel variation is one of key factors for MU-MIMO. Coherence time in the current channel model is 400msec [1].

E N D
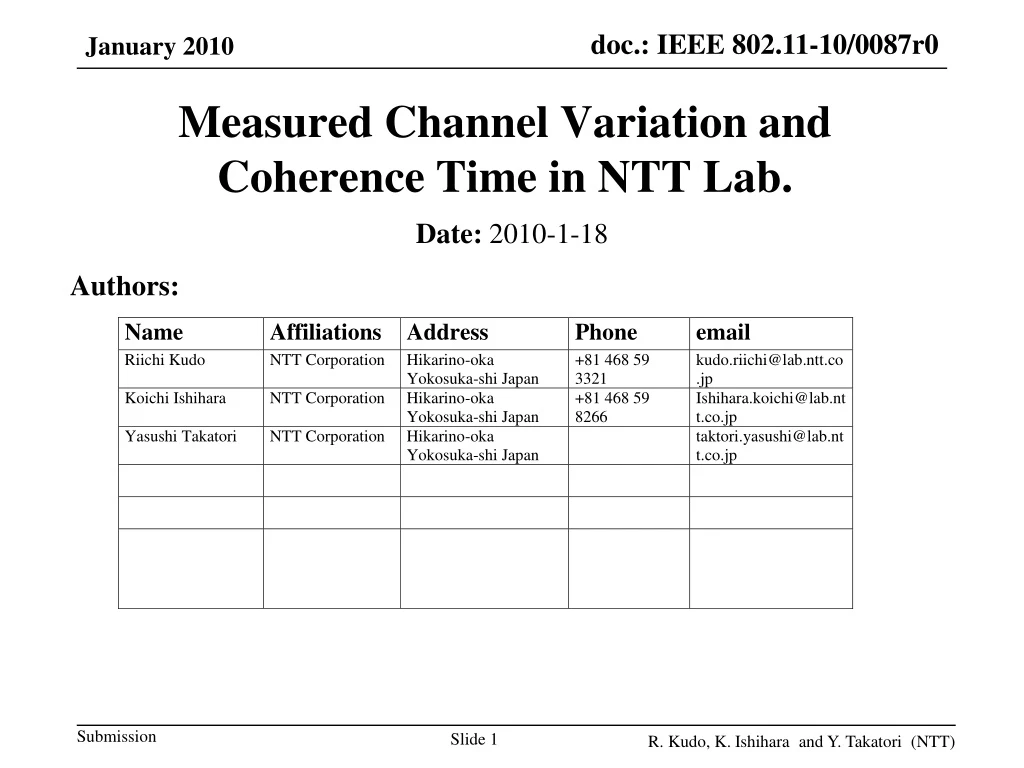
Measured Channel Variation and Coherence Time in NTT Lab. Date: 2010-1-18 Authors: R. Kudo, K. Ishihara and Y. Takatori (NTT)
Introduction • Channel variation is one of key factors for MU-MIMO. • Coherence time in the current channel model is 400msec [1]. • Previous measured results presented in TGac suggest larger coherence time [2] [3] while direct measurement of larger coherence time is difficult to actualize. • In this document, channel variation is presented by the mean squared error (MSE) of the channel matrix which is closely related to the real MU-MIMO performance. • We also present comparison with the simulation results where 11n channel model [4] is modified by setting larger coherence time. R. Kudo, K. Ishihara and Y. Takatori (NTT)
Performance Measure for Channel Variation • Measured channel matrix of k-th subcarrier at time tn: • The correlation of the channel between timing t0 and timet1 is calculated by the following equation. • MSE of the channel is approximated by the following equation [3]. R. Kudo, K. Ishihara and Y. Takatori (NTT)
MSE in Simulation Model In the simulation model, MSE in LOS is lightly smaller than that in NLOS while the difference is relatively small. “D/T” refers to the time difference normalized by channel coherence time. Numbers of Tx antennas and Rx antennas, and coherent time are assumed to be 8, 1, and 400 ms, respectively. R. Kudo, K. Ishihara and Y. Takatori (NTT)
Channel Measurement • Channel matrices were measured using 8 transmit antennas and 1 receive antenna 48 channel matrices were obtained every 1ms during 2s. We measured the NLOS channel for distance of 8m and LOS channel for distance of 4m. Measurements were conducted at three positions for each scenario. P P P P P AP 4m 8m 0m 26 m COPY P P FAX FAX COPY COPY 40 m R. Kudo, K. Ishihara and Y. Takatori (NTT)
Measurement parameter • Frequency 4.85GHz • Signal bandwidth 20MHz • Transmit power 0 dBm • Number of antennas at Tx 8 • Number of antennas at Rx 1 (4) • Antenna height (LOS) 2.7m (Tx), 0.85m (Rx) • Antenna height (NLOS) 0.85m (Tx), 0.85m (Rx) R. Kudo, K. Ishihara and Y. Takatori (NTT)
Photo of measurement place Tx Rx R. Kudo, K. Ishihara and Y. Takatori (NTT)
MSE in LOS Slopes are almost the same for both 50% and 90% value. MSE@90% is lower than -25 dB even for the delay time of 20ms. MSE differences among three positions are small. 15msec 15msec R. Kudo, K. Ishihara and Y. Takatori (NTT)
MSE in NLOS Slopes are almost the same for both 50% and 90% value. MSE keeps lower level until around 15msec. MSE in NLOS is larger than LOS especially for short time difference. MSE differences among three positions are small. 15msec 15msec R. Kudo, K. Ishihara and Y. Takatori (NTT)
Comparison with Simulations (Dt=20msec) • Slope of the measured channel was in good agreement with simulated results. • MSE of the measured channel with t of 20ms was around D/T of 0.024, • which corresponds to the delay time of 9.6ms for coherent time of 400ms. • Coherent time of measured channel corresponds to 800ms. Simulated channel for NLOS 10m Measured channel for NLOS 8m Simulated channel for LOS 4m Measured channel for LOS 4m R. Kudo, K. Ishihara and Y. Takatori (NTT)
Summary-1 Channel variation was evaluated by measured MSE in both LOS and NLOS scenarios. MSE@90% is less than -20 dBc even for time difference of 20 msec in both scenarios while measured MSE in NLOS was larger than that in LOS. CDFs of measured channel MSE at a delay of 20 msec were compared to distributions of MSE generated from the current TGac channel model. The measured results agreed well with the model at a delay of 9.6 msec. R. Kudo, K. Ishihara and Y. Takatori (NTT)
This suggests that the assumed Doppler level in the current TGac channel model is excessive by at least a factor of 2. This finding is also supported by the results of previous channel measurement campaigns presented at TGac. We recommend that the TGac Doppler model be revised to assume an equivalent coherence time of 800ms. Assuming a required channel evolution error of -30 to -25dBc, our results suggest that accurate DL MU-MIMO performance can be supported with a channel state feedback interval on the order of 15ms. Summary-2 R. Kudo, K. Ishihara and Y. Takatori (NTT)
References [1] Greg Breit et al., TGac Channel Model Addendum Document, IEEE802.11-09/308r5, May , 2009. [2] W. Yamada, K. Nishimori, and Y. Takatori, Measured Doppler Frequency in Indoor Office Environment , IEEE 802.11-09/537r0, May 11, 2009. [3] Greg Breit, Coherence Time Measurement for TGac Channel Model, IEEE 802.11-09/1173r1, Nov., 2009. [4] Erceg, V. et al., TGn Channel Models, IEEE 802.11-03/940r4, May 10, 2004. R. Kudo, K. Ishihara and Y. Takatori (NTT)