Download
1 / 43
440 likes | 452 Views
Targeting Insulin Resistance for Vascular Protection. Contents. Vascular Consequences of Diabetes and Insulin Resistance CV Risk Reduction, Diabetes Prevention, and TZDs III. Clinical Imperatives When Treating Patients with Diabetes.

E N D
Contents • Vascular Consequences of Diabetes and Insulin Resistance • CV Risk Reduction, Diabetes Prevention, and TZDs III. Clinical Imperatives When Treating Patients with Diabetes
One third of adults with diabetes are undiagnosed • ~10% of US adults have diabetes/~20 million persons in 2005 • Nearly one third don’t know they have diabetes • 26% of US adults have impaired fasting glucose (IFG)* • Total: 35% of US adults with diabetes or IFG • ~73.3 million persons Cowie CC et al. Diabetes Care. 2006;29:1263-8. NIDDK. National Diabetes Statistics. www.diabetes.niddk.nih.gov. *100–125 mg/dL
Rising prevalence of diabetes Diagnosed diabetes in US, 1980–2004 15 10 Persons with diagnosed diabetes (millions) 5 0 1980 1984 1988 1992 1996 2000 2004 Year Steinbrook R. N Engl J Med. 2006;354:545-8.
Parallel epidemics of diabetes and obesity <4% 4%–4.9% 5%–5.9% >6% 10%–14% 15%–19% 20%–24% >25% 1994 2004 Diabetes Obesity (BMI ≥30 kg/m2) CDC. www.cdc.gov.
90% of patients with newly diagnosed diabetes are overweight or obese National Health Interview Survey, 2003; N ≈ 31,000 aged 18 to 79 years 90% Obese (BMI ≥30) Diabetes patients with BMI ≥25 kg/m2 (%) Overweight (BMI 25 to <30) Geiss LS et al. Am J Prev Med. 2006;30:371-7.
IFG/IGT: Challenge for prevention Ages 40 to 74 years; US population estimates 2000 US population (millions) Fasting plasma glucose (FPG) 100–125 mg/dLand/or 2-hr OGTT 140–199 mg/dL IGT = impaired glucose tolerance OGTT = oral glucose tolerance test NIDDK. National Diabetes Statistics. www.diabetes.niddk.nih.gov. ADA. Diabetes Care. 2006;29(suppl I):S4-48.
“Ticking clock” hypothesis: Glucose abnormalities increase CV risk Nurses’ Health Study, N = 117,629 women, aged 30–55 years; follow-up 20 years (1976–1996) Relative risk of MI or stroke* No diabetes Before diabetesdiagnosis After diabetesdiagnosis Diabetes at baseline *Adjusted n = 1508 diabetes at baseline n = 5894 new-onset diabetes Hu FB et al. Diabetes Care. 2002;25:1129-34.
DECODE: IGT increases mortality risk Diabetes Epidemiology: Collaborative analysis Of Diagnostic criteria in EuropeN = 25,364 aged ≥30 years Diagnosed diabetes (n = 1275) Undiagnosed diabetes (n = 3071) Impaired glucose tolerance (n = 2766)* Normal glucose tolerance (n = 18,252)* 20 Mortality hazard (%) 10 0 0 2 4 6 8 10 Follow-up (years) *2-hour OGTT DECODE Study Group. Lancet. 1999;354:617-21.
CHD risk appears to begin at low blood glucose levels N = 17,869 men, aged 40–64 years; follow-up 33 years 1.6 1.2 CHD mortality (log hazard ratios)* 0.8 83 mg/dL 0.4 0.0 54 72 90 108 126 144 162 180 -0.4 OGTT blood glucose (mg/dL) *Relative to baseline group of all men with blood glucose <83 mg/dL Brunner EJ et al.Diabetes Care. 2006;29:26-31.
Continuum of CV risk: Reason for early intervention in patients with IFG/IGT Cardiovascular Health Study; N = 4014, age ≥65 years 1.6 2 ↑90% 1.8 ↑42% 1.4 ↑54% 1.6 CV events (hazard ratio*) ↑36% 1.2 1.4 ↑17% 1.2 † 1 † 1 0 0 ≤92 93–97 98–103 104–111 ≥112 ≤103 104–124 125–146 147–181 ≥182 FG (mg/dL) 2-h glucose (mg/dL) *Adjusted for age, sex, and race †Reference Smith NL et al. Arch Intern Med. 2002;162:209-16.
Even mild glucose elevations increase mortality in patients undergoing PCI N = 1612 with CAD; mean age 62 years P-trend < 0.001 Mortality (%) FG (mg/dL) <110 110–125 ≥126 NFG = normal FG Undx DM2 = undiagnosed type 2 diabetes Muhlestein JB et al. Am Heart J. 2003;146:351-8.
IGT and undiagnosed DM2 are common in acute MI and stroke 2-hour OGTT Myocardial infarction Stroke 66 39 (n = 181) (n = 238) IGT Undiagnosed DM2 Norhammar A et al. Lancet. 2002;359:2140-4.Matz K et al. Diabetes Care. 2006;792-7.
Risk of endothelial dysfunction increases at FG 110–125 mg/dL N = 579 without diabetes or prior CV disease FMD change Endothelial dysfunction 8 100 6 P < 0.05 10 % Odds ratio (95% Cl)* 4 1 2 0 0 <90 100–109 110–125 90–99 90–99 100–109 110–125 FG (mg/dL) FG (mg/dL) (Referent = FG <90 mg/dL) *Unadjusted FMD = flow-mediated dilation Rodriguez CJ et al. Am J Cardiol. 2005;96:1273-7.
Impaired macrovascular reactivity in people at risk for type 2 diabetes P < 0.01* 13.7 10.5 9.8 Increase from baseline after cuff occlusion (%) 8.4 *vs relatives, IGT, diabetes Caballero AE et al. Diabetes. 1999;48:1856-62.
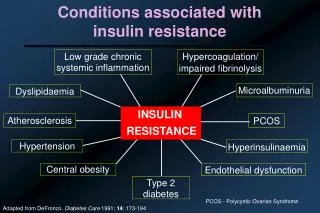
Insulin resistance: Risk factor for CV disease • Important feature of diabetes, obesity, glucose intolerance, and dyslipidemia • Key component of CV disorders: hypertension, CAD, and atherosclerosis • Independent risk factor for atherosclerosis Insulin resistance promotes atherosclerosiseven before it produces diabetes Kim J-a et al. Circulation. 2006;113:1888-904. Ridker P, Libby PJ. In Braunwald’s Heart Disease. 7th ed.
Insulin resistance and atherosclerosis Genetic factors • Acquiredconditions Insulin resistance Vasoconstriction Thrombosis INFLAMMATION ACCELERATED ATHEROSCLEROSIS Kim J-a et al. Circulation. 2006;113:1888-904.
Who has insulin resistance? % Patients DM21 ↓HDL + ↑TG2 HTN3 Stroke4 CHD5 Refer to cardiol.6 Age 40 to 747 1Haffner et al. Diabetes. 1997. 2McLaughlin et al. Am J Cardiol. 2005.3Reaven et al. N Engl J Med. 1996. 4NIH. www.clinicaltrials.gov. 5Lankisch et al. Clin Res Cardiol. 2006.6Savage et al. Am Heart J. 2005. 7www.diabetes.niddk.nih.gov/.
Insulin resistance is an independent predictor of HF N = 1187 men, aged ≥70 years; follow-up 8.9 years 25 20 Inverse relationship between HF incidence and insulin sensitivity HF incidence/ 1000 person-years at risk* 15 10 5 0 I II III IV Insulin resistance quartiles† *Adjusted for HF risk factors †Quartiles of clamp glucose disposal rate (mg/kg body weight per min) Ingelsson E et al. JAMA. 2005;294:334-41.
Insulin resistance increases risk of chronic kidney disease (CKD) N = 6453 without diabetes P = 0.001 P = 0.008 Odds ratio (highest vs lowest quartiles*) *Multivariate adjustedCKD = GFR <60 mL/min per 1.73 m2 HOMA-IR = Homeostasis model assessment of insulin resistance Chen J et al. J Am Soc Nephrol. 2003;14:469-77.
Development of insulin resistance in obesity-induced inflammation and stress Overnutrition and genetics Macrophage Paracrine and autocrine inflammatory signals Endocrine inflammatory signals Fatinsulin resistance Systemic insulin resistance Muscle insulin resistance Liver insulin resistance Dyslipidemia, hypertension, hyperglycemia Accelerated atherosclerosis Adapted from de Luca C, Olefsky JM. Nat Med. 2006;12:41-2.
Visceral obesity CT scans from men matched for BMI and total body fat White = visceral fat area (VFA); black = subcutaneous fat Visceral obesity Fat mass: 19.8 kg VFA: 155 cm2 Visceral obesitydrives CV risk progression independent of BMI Subcutaneous obesity Fat mass: 19.8 kg VFA: 96 cm2 Després J-P. Eur Heart J Suppl. 2006;8(suppl B):B4-12.
Visceral fat independently predicts mortality N = 291 men, mortality follow-up 2.2 years Mortalityodds ratio (95% CI)* P Visceral fat mass 1.81 (1.04–3.14) 0.04 Subcutaneous fat mass 0.99 (0.63–1.58) 0.98 Liver fat 0.87 (0.56–1.37) 0.55 Waist circumference 0.60 (0.25–1.44) 0.26 *Adjusted for age, follow-up time, and other fat measures Kuk JL et al. Obesity. 2006;14:336-41.
CRP levels show positive correlation with visceral obesity N = 159 men, mean age 43 yr; BMI 21.0–41.0 kg/m2 Visceral fat area Waist circumference 110 * † ‡ * * ‡ ‡ † * * * * 105 * 100 cm2 cm 95 90 CRP quintiles CRP quintiles Lemieux I et al. Arterioscler Thromb Vasc Biol. 2001;21:961-7.Després J-P. Eur Heart J Suppl. 2006;8(suppl B):B4-12. P < 0.0001 vs *quintile 1; †quintile 2; ‡quintile 3
Shared CV risk between insulin resistance and visceral obesity Hypertension ↑SBP/DBP Absent nocturnalBP dipping Dyslipidemia ↓HDL-C↑Apo B Small dense LDL ↑TG Insulin resistance andvisceral obesity Inflammation ↑CRP + other markers Endothelial dysfunction Renal changes Microalbuminuria ↑Uric acid Altered hemostasis ↑Fibrinogen ↑PAI-1 ↑Blood viscosity McFarlane SI et al. J Clin Endocrinol Metab. 2001;86:713-8.
CRP IL-6 PAI-1 Angiotensinogen Leptin Resistin MCP-1 TNFα Adiponectin Metabolically active molecules link obesity and atherosclerosis Adipocytokines (adipokines) Atherogenic Antiatherogenic Lau DCW et al. Am J Physiol Heart Circ Physiol. 2005;288:H2031-41. Wellen KE, Hotamisligil GS. J Clin Invest. 2005;115:1111-9.
↑ Endothelial vasodilation ↑ Nitric oxide ↑ Angiogenesis ↓ VCAM-1 ↓ TNF level and proinflammatory effects ↓ Oxidized LDL effects on EC ↓ EC proliferation/migration ↓ Growth factor effects on SMC ↓ Neointimal thickening ↓ SMC proliferation Antiatherogenic effects of adiponectin EC = endothelial cells SMC = smooth muscle cells VCAM = vascular cell adhesion molecule Goldstein BJ, Scalia R. J Clin Endocrinol Metab. 2004;89:2563-8.
Visceral obesity and adiponectin N = 104 women; 12-week follow-up 30 P < 0.0001 P < 0.01 25 P < 0.0001 20 Plasma adiponectin (µg/mL) 15 10 5 0 Non-obese Gynoid (nonvisceral) Android(visceral) Obesity* status Median *BMI > 28 kg/m2 Manigrasso MR et al. J Clin Endocrinol Metab. 2005;90:5876-9.
Inverse relationship between baseline adiponectin level and MI risk n = 798, case-control study; follow-up 6 years* 1.2 1.0 0.8 Relative risk of MI(95% CI) 0.6 0.4 0.2 0 I II III IV V Quintile ofadiponectin Median adiponectin (mg/L) 7.9 12.6 16.5 21.1 29.2 Multivariate adjusted (PTrend < 0.001) Multivariate + lipid adjusted (PTrend = 0.02) *Health Professionals Follow-up Study Pischon T et al. JAMA. 2004;291:1730-7.
Shared metabolic abnormalities with insulin resistance and endothelial dysfunction Glucotoxicity Lipotoxicity Inflammation • Oxidative stress • AGE formation • Pro-inflammatory signaling • Oxidative stress • Pro-inflammatory signaling • Pro-inflammatory factors • Kinases/transcription factors Insulin resistance Endothelial dysfunction AGE = advanced glycation end product Adapted from Kim J-a et al. Circulation. 2006;13:1888-904.
PPAR activation and atherosclerosis: A hypothesis – – – – Ligand:Endogenous or synthetic Activated PPAR DirectVascular and inflammatory cells IndirectFat, liver, skeletal muscle cells Reducesinflammation Cytokines Chemokines Cholesterol efflux Adhesion molecules FFA Glucose Insulin sensitivity Triglycerides HDL Atherogenic LDL Blunts atherosclerosis Plutzky J. Science. 2003;302:406-7.
Peroxisome proliferator-activator receptors (PPARs) • PPAR , , and belong to the nuclear hormone receptor superfamily • PPAR agonists appear to play a critical role in regulating inflammation, lipoprotein metabolism, and glucose homeostasis • Studies suggest that PPAR agonists exert antiatherogenic effects by inhibiting proinflammatory gene expression and enhancing cholesterol efflux • PPAR agonists have potential in the treatment of obesity, diabetes, and atherosclerosis Li AC et al. J Clin Invest. 2004;114:1564-76. Blaschke F et al. Arterioscler Thromb Vasc Biol. 2006;26:28-40.
PPARs: Overview Blaschke F et al. Arterioscler Thromb Vasc Biol. 2006;26:28-40. Semple RK et al. J Clin Invest. 2006;116:581-9.
Beyond fat and glucose: Potential for CV benefits with PPAR agonists • PPAR is expressed incell types associated withCV disease • Vascular endothelial cells (EC) • Vascular smooth muscle cells (VSMC) • T-lymphocytes • Monocyte/macrophages • Cardiac myocytes • Renal tubule cells Lumen Lumen Necrotic core EC VSMC Monocytes Adapted from Marx N et al. Arterioscler Thromb Vasc Biol. 1999;19:546-51.
Obesity induces inflammatory changes in adipose tissue Wellen KE, Hotamisligil GS. J Clin Invest. 2003;112:1785-8.
Macrophage and adipocyte similarities Adipocyte • Energy/lipids • Inflammation Macrophage • Inflammation • Lipid storage • Insulin resistance PPARg and LXR oppose these actions in both macrophages and adipocytes LXR = liver X receptor Wellen KE, Hotamisligil GS. J Clin Invest. 2005;115:1111-9.
PPAR signaling pathways influence macrophage gene expression and foam-cell formation Atheroscleroticblood vessel Macrophage Atherogenicinflammation PPAR PPAR PPAR/ LXR ? ABCG1 ABCA1 Cholesterol effluxHDL acceptor ApoE,PLTP Cholesterol effluxApoA1 acceptor LXRα = liver X receptor α PLTP = phospholipid transfer protein Castrillo A, Tontonoz P. J Clin Invest. 2004;114:1538-40.
PPAR agonists improve endothelial vasodilation and decrease inflammation N = 80 with hypertension or hypercholesterolemia and no diabetes; change after 16 weeks 7 600 P = 0.01 6 P = 0.0001 5 500 P = 0.0008 Forearm blood flow(% from baseline) 4 P = 0.38 CRP (mg/L) 3 400 2 300 1 0 0 Insulin sensitive Insulin resistant All subjects 400 200 0 100 Bradykinin (ng/min) Placebo Pioglitazone 45 mg/d Campia U et al. Circulation. 2006;113:867-75.
PPAR agonists impact inflammatory markers and adiponectin Placebo Rosiglitazone 8 mg/d N = 54 adults with metabolic syndrome and no diabetes; change after 12 weeks CRP IL-6 Adiponectin ‡ Change from baseline (%) † * *P = 0.002; †P = 0.027; ‡P < 0.001 Samaha FF et al. Arterioscler Thromb Vasc Biol. 2006;26:624-30.
Added benefit of BP reduction with PPAR agonists N = 87 with diabetes; PPAR agonist added to glimepiride 4 mg/d; change after 12 months Systolic Diastolic Change in BP (mm Hg) * * * * Pioglitazone 15 mg/d Rosiglitazone 4 mg/d *P < 0.05 vs baseline Derosa G et al. Hypertens Res. 2005;28:917-24.
PPAR agonists increase collagen content – potentially improving plaque stability N = 24 without diabetes; change after 4 weeks in carotid endarterectomy samples P = 0.04 Placebo Rosiglitazone8 mg/d Meisner F et al. Arterioscler Thromb Vasc Biol. 2006;26:845-50.
Potential vascular benefits of PPAR activation PPAR agonists Improved substrate metabolism Thrombosis Plaque stability Cell recruitment and activation Inflammatory response Vasoconstriction Cell migration Foam cell formation Cholesterol efflux Atherogenesis Cariou B et al. Br J Diabetes Vasc Dis. 2005;5:126-32.