Download
1 / 36
380 likes | 558 Views
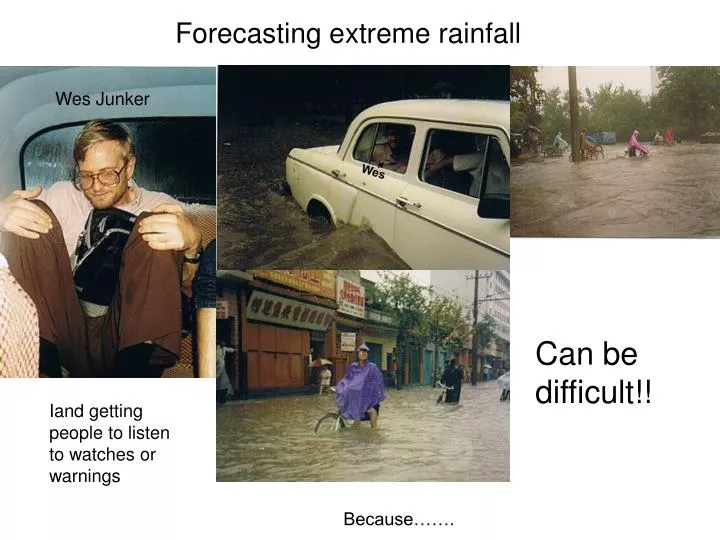
Forecasting extreme rainfall. Wes Junker. Wes. Can be difficult!!. Iand getting people to listen to watches or warnings. Because……. From. Climatology of Heavy Rain Events in the United States from Hourly Precipitation Observations HAROLD E. BROOKS AND DAVID J. STENSRUD.

E N D
Forecasting extreme rainfall Wes Junker Wes Can be difficult!! Iand getting people to listen to watches or warnings Because…….
From Climatology of Heavy Rain Events in the United States from Hourly Precipitation Observations HAROLD E. BROOKS AND DAVID J. STENSRUD 5 inch an hour rainfall rates lasting an hour are very, very rare but……do happen Frequency changes with seasons Inch an hour rainfall frequency.
Because higher amounts or thresholds are relatively rare, it is difficult getting a big enough sample to calibrate forecasts using traditional statistical techniques. Verification of 24 hour QPF for various thresholds mm 25 50 75 100 mm 25 50 75 THE AREA OBSERVED DECAYS LOGARITHMICALLY AS THRESHOLDS INCREASE THE ACCURACY OF FORECASTS ALSO DECAYS LOGARITHMICALLY EXCEPT FOR THE VERY HIGHEST THRESHOLDS
From Charles E. Konrad II (2001) The Most Extreme Precipitation Events over the Eastern United States from 1950 to 1996: Considerations of Scale 500,000 km2 100,000 km2 2,500 km2 SON DJF MAM JJA
Precipitation with mesoscale convective systems is very difficult to predict Inside the red line, the probability of 1 mm is 100% but the probability of 3 inches is only a little above 10% in the blue area
Extreme rainfall is a moving target • May occur in association with a synoptic scale event • In winter, 1” to 2 inches of rain over a basin may cause flooding • In summer, flash flooding may occur due to a mesoscale system or even occur from a single storm that remains quasistationary and has intense rainfall rates
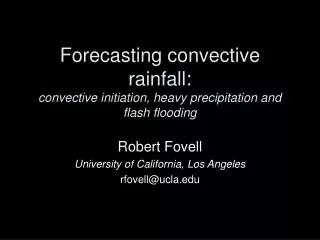
Forecasting extreme rainfall events • You need to understand which combination of ingredients that can lead to • High rainfall rates • For an extended period • Most extreme rainfall events are associated with convection. • You need moisture, instability and lift. • or by strong lifting due to orography
A various time ranges • The methods of trying to predict extreme rainfall differ • At shorter time ranges • Mesoscale analysis, satellite and radar imagery are often the best tools for pinpointing where an event is most likely and are used to monitor ongoing convective trends • At longer time ranges, numerical models and ensemble forecast systems provide information about potential extreme events.
START BY LOOKING AT SYNOPTIC SCALE (THE BIG PICTURE) • THERE IS A CLEAR ASSOCIATION BETWEEN SHORT-WAVE TROUGHS AND CONVECTION • THE VERTICAL MOTION ASSOCIATED WITH SYNOPTIC SCALE LIFT DOES NOT TYPICALLY ALLOW PARCELS TO REACH THE LEVEL OF FREE CONVECTION (LFC) • HOWEVER, LARGE SCALE LIFT • STEEPENS LAPSE RATE • PROMOTES MOISTURE TRANSPORT • WEAKENS CAP • AFFECTS VERTICAL SHEAR (more important for severe weather forecasting)
SHORT RANGE (0-3 HR) FORECASTS • RELY PRIMARILY ON CURRENT OBSERVATIONS AND TRENDS • NEXRAD AND SATELLITE IMAGERY ARE GREAT TOOLS PROVIDING INFORMATION ON THE , SIZE AND INTENSITY AND MOVEMENT OF PRECIPITATION SYSTEMS • HAVE TO KNOW LIMITATIONS OF OBSERVING SYSTEMS • STILL HAVE TO ANTICIPATE NON-LINEAR CHANGES • NEW CELLS FORMING UPSTREAM
THE AMOUNT OF RAINFALL THAT FALLS OVER AN AREA DEPENDS ON • SIZE and SHAPE OF THE RAINFALL AREA • THE INTENSITY OF THE RAINFALL WITHIN IT • HOW FAST THESE AREAS MOVE • HOW FAST NEW RAIN BEARING CLOUDS ARE FORMING UPSTREAM (PROPAGATION) Sound Easy?
A FEW IDEAS TO HELP DETERMINE HOW BIG AN AREA OF RAINFALL TO FORECAST • THE SIZE IS DEPENDENT ON HOW MUCH MOISTURE IS PRESENT AND ON THE STRENGTH OF THE MOISTURE TRANSPORT • IS DEPENDENT ON BOTH THE ABSOLUTE (PWS, MIXING RATIOS), RELATIVE MOISTURE (RH) AND WIND SPEED AND DIRECTION • SIZE IS DEPENDENT ON THE SCALE OF THE FORCING • PATTERN RECOGNITION OFTEN PROVIDES CLUES BUT YOU NEED TO UNDERSTAND WHY THE PATTERN IS FAVORABLE FOR HEAVY RAINFALL. • MODEL GUIDANCE PROVIDES A DECENT FIRST GUESS, ESPECIALLY OF COOL SEASON STRATOFORM EVENTS • NOT SO GOOD WITH RAINFALL FROM CONVECTION • An argument for using pattern recognition • And ensemble guidance to get a better feel about a systems potential.
Schematic representing the affect the shape and movement of a system has on the rainfall at a particular point. The shaded colors on the system represent the radar echoes. RAINFALL RATE RAINFALL RATE RAINFALL RATE RAINFALL RATE TIME TIME TIME TIME From Doswell et al., 1996 (Weather & Forecasting, 11, 560-581) You live at the blue dot Adopted from Doswell et al. 1996
Where new cells form in relation to the initial convection is important, to • Determining the mode of development • Whether the system will look like this • Determining the speed and direction the system will move Or this Or this
The mode of development and propagation is influenced by a number of factors. • OUTFLOW • EVAPORATIONAL COOLING RELATED TO THE ENVIRONMENTAL HUMIDITY • GUST FRONT SPEED RELATED TO TEMPERATURE DEFICIT BETWEEN OUTFLOW AND AIR AROUND IT. • WHERE THE STRONGEST LOW-LEVEL CONVERGENCE, MOISTURE AND INSTABILITY IS LOCATED • SYSTEM RELATIVE WINDS • DETERMINES WHERE LOW LEVEL CONVERGENCE WILL BE LOCATED. • INTERACTION OF UPDRAFT WITH ENVIRONMENTAL WIND
Rainfall rates • Vertical moisture transport into the system which is dependent • on the amount of moisture that is available. Precipitable water, dewpoints, winds, moisture flux • The magnitude of the vertical motions • What produces the strongest vertical motion and rainfall rates? • Convection • High CAPE • The proportion of the condensate that is fed into the cloud that reaches the ground (the precipitation efficiency) • Which is dependent on the shear • Relative humidity • An even shape of the sounding
What is precipitation efficiency • The ratio of moisture that falls beneath the cloud to how much moisture is being fed into it. • High precipitation efficiency is more likely when • Mean relative humidity is high • Cloud bases are low • Don’t want a lot of shear • More likely with warm rain processes • And airmass with maritime origins • Because of having a more larger hygroscopic nucleii (more large salt particles. • On radar look for high reflectivities below the zero wetbulb.
Madison County flash flood event at 1800 UTC A high precipitation efficiency event 1800 UTC IAD sounding CAPE is low but positive Relative humidity is high PW is <2.00 inches Not much shear, weak mean winds compared to low level winds Low centroid of max echo returns <55 DBZ Low centroid mean it’s not hail but rain…..very heavy rainfall
MOVEMENT OF THE SYSTEM • SLOW MOVING SYSTEMS ARE USUALLY THE HEAVIEST RAINFALL PRODUCERS • AT SHORTER TIME RANGES-EXTRAPOLATION BASED ON RADAR AND SATELLITE PROVIDES PRIMARY GUIDANCE • AT LONGER RANGES, MODELS CAN PROVIDE A FIRST GUESS, BUT • YOU STILL NEED TO TAKE INTO ACCOUNT MODEL CHARACTERISTICS AND BIASES. • AT ALL TIME RANGES, YOU MUST ANTICIPATE WHEN NEW ACTIVITY MAY FORM UPSTREAM (Propagation effects)
A slow moving or backbuilding MCS is more likely when • When weak 850-300 mean winds are present. • When the low level jet is upstream and of the MCS location and the low level jet is strong compared to the 850-300 mb mean wind. • When you expect the MCS to be near the upper level ridge. • When veering winds with heightdominate speed shear • When the strongest moisture transport and low-level convergence is located upstream from the MCS. • When the airmass is unstable upstream but stable downstream • When the mean RH is high.
Models often have problems handling the development and motion of MCSs • Because of lack of data • This is especially true when dealing with • The vertical and horizontal distribution of temperature and moisture • Unfortunately, the vertical distribution of moisture and temperature governs where the airmass is unstable or not. • Because certain physical processes occur below the scale that the NCEP operational models can resolve • The following physical processes are therefore parameterized (and are handled in rather crude ways) • Convection (in mesoscale models), within cloud microphysical processes, radiation, boundary layer processes
USE MODELS TO IDENTIFY SYNOPTIC AND MESOSCALE PATTERNS THAT ARE FAVORABLE TO HEAVY RAINS • CAN USE THE SURFACE, 850- AND 500-MB PATTERNS TO IDENTIFY MADDOX ET AL. OR OTHER TYPES OF HEAVY RAINFALL EVENTS • ALSO NEED TO LOOK CLOSELY AT MOISTURE, MOISTURE TRANSPORT AND INSTABILITY • MODELS OFTEN PROVIDE DECENT FORECASTS OF LOW-LEVEL WIND AND MOISTURE FIELDS • 850 MOISTURE TRANSPORT (MOISTURE FLUX) • PWS • OUTPUT CAN BE USED TO ASSESS FORCING AND TO FORECAST THE LOCATION OF BOUNDARIES. • Ensembles can provide information about the probability of the pattern actually occurring.
Use models to identify patterns associated with extreme rainfall. Composite for East coast synoptic type Lets look at a classic synoptic heavy rainfall event in the east Borrowed from Rich Grumm
SREF has synoptic pattern right Bottom panels 850 winds and normalized anomalies 250wind & v-anom L L Correctly predicts strong southern wind anomalies, PW anomalies of greater than 2
12-36 hr gfs 12-36 hr NAM observed Heavier and farther southeast All valid at 1200 UTC 26 June
SREF again does better at recognizing pattern than forecasting QPF SREF probability of 2.00 inches Probability of 2.00 inches was 20% and in the wrong place Observed
Another case Strong agreement about the synoptic pattern. Forecast Observed
Stronger than normal low level jet….over 3 SD v-wind component at 850, Some uncertainty about placement of moisture plume (PW across threat area)
SREF trending towards high MF anomalies…greater than 5 SD. NAM (right) forecasting greater than 5 SD.
For extreme events is there a better way than trying to deterministically forecast a extreme event or forecast the probability of an event at a single point Imagine a non-hydrostatic model forecasting 125 mm (5 inches) or more of rain (magenta). It verifies as the light blue area Forecast Actual Event Reporting station 30 miles A perfectly predicted 125 mm area having a position error may be a terrible forecast. Or is it?
Or is it? How Good Are these hypothetical ensemble forecasts? How do you statistically forecast the probability of such a small scale event? Ensemble members observed In this case, the probability of 125 mm (5 inches) would be zero based on the raw ensemble members but, all ten forecast a major event. Within the circle, 100% of the members forecast 5 inches Your point probability forecasts of such an event will always be small
Even with 100% of the ensemble members forecasting an event, what does it mean • Do the model members have an individual bias for each member • If you use probabilities based on ensembles, are they well calibrated. • is there a resolution problem that may bias the members? • For the GEFS and SREF when dealing with weak summertime forcing, probably yes
Forecasting extreme rainfall requires • Looking at the synoptic, mesoscale and storm scale environments • For any one location they are rare and often of small scale making it difficult to deterministically predict the exact location of the rainfall maximum • We need to develop better ways to convey the potential for extreme rainfall