Download

1 / 30
310 likes | 518 Views
The Measurement of Adhesion Force between Carbon Particles and the Substrate by AFM. Zhang Tianqi 1 , Peng Wei 1 , Shen Ke 1 , Yu Suyuan 2

E N D
The Measurement of Adhesion Force between Carbon Particles and the Substrate by AFM Zhang Tianqi1, Peng Wei1, Shen Ke1, Yu Suyuan2 (1. Institute of Nuclear and New Energy Technology of Tsinghua University, Key Laboratory of Advanced Reactor Engineering and Safety of Ministry of Education, Tsinghua University 2. Center for Combustion Energy, Key Laboratory for Thermal Science and Power Engineering of Ministry of Educations, Department of Thermal Engineering, Tsinghua University)
OUTLINE • Context • Motivation of Research on Adhesion Force • Experimental Preparations • Measurements • Results & Analysis
1. Context • Graphite materials in HTGRs is mainly used in: • fuel coating material; • reflector material; • Carbonaceous dust generated from: (Kissane (2009)) • Graphite from abrasion in the core; • carbon from decomposition of hydrocarbons (oil contamination); • carbon from decarburization of steel alloys;
2. Motivation of Research on Adhesion Force • Fad: an indicator of the solidity that a particle contacts with the wall; • a key factor in study of motion behavior of graphite dust. Photo and microscopy picture of a segment mechanical decontamination: about 60%
Johnson et al. (1971) proposed JKR model to calculate the intermolecular forces acting between two bodies. This model assumes a contact zone arising from elastic deformation due to interaction forces, and the contact area remained finite before critical pull-off force being imposed. • graphite dust : 1. microns or sub-microns. Fad is quite small. 2. Irregular particles & rough surface. • It is essential to employ fine measurement method to measure the force.
3. Experimental Preparations • AFM • Measuring Principle & Force Curve • Substrate Samples & Particle Samples • Experiment Facilities
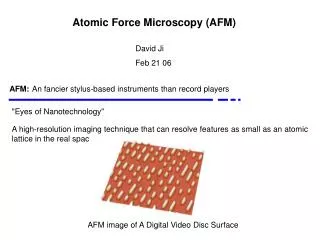
Atomic Force Microscope (AFM): • a fundamental tool to get surface structures & surface forces • extensively used in the polymer materials, microelectronics industry, biology, etc.
Measuring Principle & Force Curve AFM uses tiny cantilever, which could contact with the sample surface within the scope of atomic distance, to sensor the interaction force F. The elastic cantilever flexes when sensing changes in stress. Position Sensitive Photo-detector outputs signal voltage U reflecting flexion of the cantilever when it is cast by a laser beam. the spring coefficient of cantilever + “voltage- load” → the curve of F changing with sample displacement z is obtained Schematic of AFM
approach – contact – loading – loading to preset voltage value – withdraw –abrupt separation The retrieved force curve was initially overlapping the loading force curve due to the elasticity of particle samples. However, a larger force was needed to separate the particle and the substrate. The extra exerted force was used for balancing out the binding force produced from the contact area. This part was regarded as the measured Fad.
Substrate Sample Machined into different 2 roughness: IG110 I IG110 II Inconel 800 I Inconel 800 II
Experimental Facilities Surface Profile Analyzer: AFM System: Micro XAM – 3D white light interferometry profilometer Bare Cantilever: MFP- 3DTM (Asylum Research) produced by CypherTM TL-CONT-10 type produced by NanosensorTM
Measurement Prepare the Modified Cantilevers . • Use expoxy as the binder; • put under the ultraviolet lamp for about 30 minsuntil the binder cured; • SEM images verified that the particles were not submerged in the binder • For irregular particles, equivelant particle diameter • dp of three samples :7.71μm,7.99μm,4.69μm.
Adhesion Force Measurement Randomly choose 8 test points in each substrate sample. Repeatedly conduct measurements for 3 times in each point.
Results & Analysis Sample I :mesophasecarbon microsphere 2#_800H_R1 2#_IG110_R1 2#_800H_R2 2#_IG110_R2
Sample II:fine debris of coating graphite on fuel elements of HTR-10 4#_800H_R1 4#_IG110_R1 4#_800H_R2 4#_IG110_R2
Sample III :graphite powder NBG18 7#_800H_R1 7#_IG110_R1 7#_800H_R2 7#_IG110_R2
The measured Fad densely distributed in repeated contacts of each test point, but sparsely scattered in different points. • Data of Inconel 800H was more decentralized comparing with that of IG110. • No perfect repeatability • The profile of substrate samples, the morphology of particle samples and the contact mode are predicted to have impacts on the measured Fad .
Profile of Substrate Samples D: Inconel 800H I B: IG110 I A: mica E: Inconel 800H II C: IG110 II
Table 1 Major Profile Parameters of Sample Substrates dpof three particle samples is respectively: 7.71μm,7.99μm,4.69μm
Take average value: Adhesion Force Fad for 3 Carbon Samples According to JKR model,
Qualitative Explanation • Shape factor → Contact Area • Limited deformation
asperities of sample substrate • Roughness can reduce Fad in a certain scale; • However, when the size of asperities almost is equal to or greater than dp, Fadincreases with the increasing contact area.
Force Curve Analysis Particle Sample IIvs. IG110 Sample Substrate Standard Force Curve
Sample I is mesophase carbon microsphere, prepared by Taiwan's chemical co., LTD. The carbon content reached 98%wt after carbonization in 1000℃. • This sample developed from asphalt and other liquid-phase organic compounds. The nematic-liquid-crystal mesophase carbon formed a microsphere under the action of surface tension. Mesophase carbon microspheres can be used for the preparation of isotropic graphite and lithium-ion battery anode materials (Ke Shen, 2009).