Download
1 / 27
270 likes | 274 Views
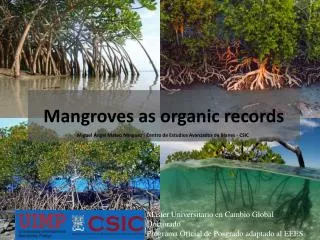
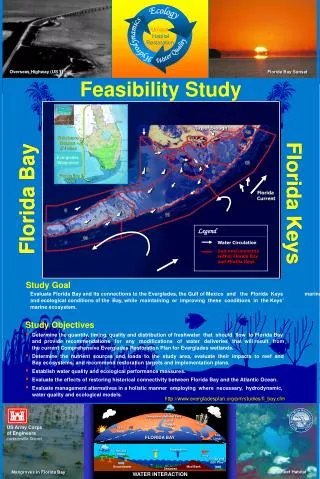
Explore the critical roles of mangrove forests in coastal ecosystems, including biological productivity, coastal protection, and organic matter processing. Learn about the unique adaptations of mangroves to saline environments, such as aerial root systems and leaf anatomy.

E N D
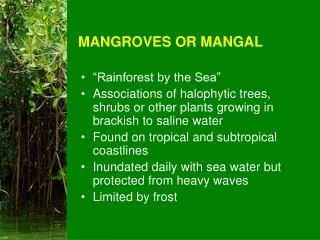
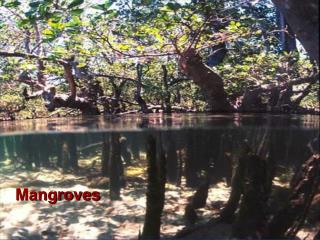
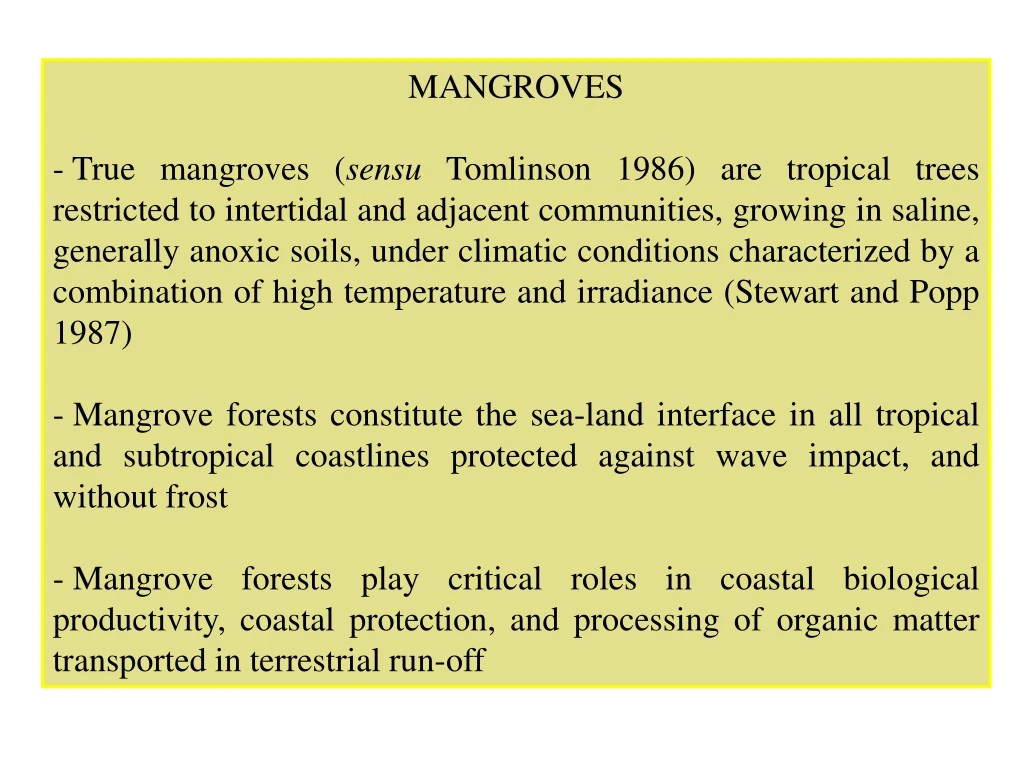
MANGROVES • True mangroves (sensu Tomlinson 1986) are tropical trees restricted to intertidal and adjacent communities, growing in saline, generally anoxic soils, under climatic conditions characterized by a combination of high temperature and irradiance (Stewart and Popp 1987) • Mangrove forests constitute the sea-land interface in all tropical and subtropical coastlines protected against wave impact, and without frost • Mangrove forests play critical roles in coastal biological productivity, coastal protection, and processing of organic matter transported in terrestrial run-off
- Mangroves are typical halophytes developing up to reproductive stage in sea water, accumulating large amounts of sodium chloride in their cell vacuoles (Walter and Steiner 1936) - Salt, water, and energy balances, constitute simultaneous constraints for mangrove photosynthetic productivity, particularly in mangal habitats where supply of fresh water through rainfall or riverine flow is restricted - Nutrient supply modulates the responses of mangroves to environmental stresses (Boto 1983) - Nutrient supply to mangrove ecosystems is predominantly associated with terrestrial drainage,comparatively richer than sea water (Lugo et al. 1976)
Asimetric distribution of mangrove forests in South America Along the western coast the Humboldt current transports cool waters northwards causing lack of rain. Along the east coast warm equatorial Atlantic water flow southwards
Families and genera of true mangroves based on their distribution and apparent requirements of saline environments (from Tomlinson 1986) Family and Genera No. of species American species Avicenniaceae Avicennia 9 A. germinans A. schaueriana A. bicolor Combretaceae Laguncularia 1 L. racemosa Lumnitzera 3 Conocarpus 1 C. erectus Meliaceae Xylocarpus 3 Myrsinaceae Aegiceras 2 Pellicieraceae Pelliciera 1 P. rhizophoreae Plumbaginaceae 2 Aegialitis Rhizophoraceae Bruguiera 6 Ceriops 2 Kandelia 1 Rhizophora 3 R. mangle R. racemosa Sonneratiaceae Sonneratia 5 Total: 13 genera 39 species 8 American species
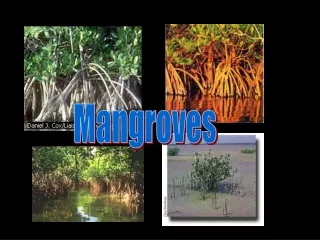
Types of aerial root systems in strict mangroves (Gill and Tomlinson 1975) Morphological adaptations of the Mangrove genera root system to flooding Stilt roots Rhizophora, Bruguiera, Ceriops Avicennia (sporadically) Pneumatophores Avicennia, Sonneratia, Laguncularia (facultative) Root knees Bruguiera and Ceriops Lumnitzera, Xylocarpus Plank roots Xylocarpus Fluted buttresses Pelliciera Without special aerial roots Aegiceras, Aegialitis, Kandelia
0.2 mm A B C Leaf anatomy of mangroves showing thickness of “water parenchyma” (Walter and Steiner 1936) Sonneratia alba Rhizophora mucronata Ceriops tagal Bruguiera gymnorrhiza Avicennia marina Lumnitzera racemosa D F E
Accumulation of ions in leaves is compensated by simultaneous water uptake: ion concentration per unit leaf area increases as the leaf ages, but the ion concentration pero unit tissue water remains constant
(after Werner & Stelzer 1990) Upper epidermis Differential accumulation of ions in leaf tissues of R.m. Upper hypodernis Mesophyll Lower hypodermis Lower epidermis
Concentration of salt in xylem sap (Scholander et al. 1962) NaCl g l-1 Leaves with salt secreting glands Rhizophora mucronata 0.2-0.4 - Sonneratia alba 0.2-0.5 - Bruguiera cf. exaristata 0.3-0.5 - Aegiceras corniculatum 0.8-2.8 + Avicennia marina 1.2-4.0 + Aegialitis annulata 3.6-8.0 + Species
Selectivity ratios (SK.Na = (Ktissue/Natissue)/(Kcult.solution/Nacult.solution) in leaf and root tissues of Avicennia marina and Rhizophora stylosa cultivated under different salinities (from Clough 1984) Species and tissue SK.Na % sea water 0 25 50 65 100 Avicennia marina leaves 0.1 10.1 12.1 17.0 11.1 roots 0.2 14.6 16.4 18.7 18.1 Rhizophora stylosa leaves 0.2 11.1 9.4 10.3 7.0 roots 0.1 5.1 4.2 4.4 3.2
Concentration of organic solutes of low molecular weight in mangroves (from Stewart and Popp 1987) Species Solute mol m-3 tissue water Aegialitis annulata pinitol 105 chiroinositol 150 proline 28 Aegiceras corniculatum mannitol 230 Avicennia marina glycinbetaine 61 Bruguiera gymnorrhiza 1D-1-O-methyl-muco-inositol 80 Ceriops tagal 1D-1-O-methyl-muco-inositol 150 Lumnitzera littorea mannitol 110 Rhizophora apiculata 1D-1-O-methyl-muco-inositol 220 Sonneratia alba mannitol 200 Xylocarpus mekongensis proline 57
Variation in the leaf inclination with the degree of exposure in five mangrove species in Hinchinbrook Island, North Queensland (Ball et al. 1988). (The projected fraction of leaf area= cos a, where a is the angle of the leaf respective to the horizontal; exposure is expressed as shade (Sh), medium sun (MS), and full sun (FS) Species Exposure Leaf Area Projected Succulence (cm2) fraction (g m-2) B. gymnorrhiza Sh 67 ± 5 0.83 ± 0.04 236.5 ± 8.0 MS 70 ± 14 0.79 ± 0.01 332.0 ± 35.4 FS 58 0.56 262.5 R. apiculata Sh 78 ± 9 0.94 ± 0.01 262.4 ± 21.9 MS 75 ± 5 0.60 ± 0.04 285.9 ± 16.8 FS 69 ± 7 0.37 ± 0.09 348.4 ± 41.1 R. stylosa Sh 61 ± 7 0.95 ± 0.03 258.5 MS 60 ± 20 0.57 ± 0.04 321.4 ± 11.2 FS 44 ± 2 0.30 ± 0.03 387.9 ± 35.5 C. tagal Sh 49 ± 1 0.93 ± 0.03 310.1 ± 9.2 MS 20 ± 3 0.63 ± 0.05 351.9 ± 33.9 FS 8 ± 1 0.36 ± 0.08 463.2 ± 55.4
Variations of apparent quantum yield of leaves grown under full exposure or partial shade of mangrove species on northern Australia (Björkman et al. 1988) Species Exposure f O2 (mmol O2 mol-1 photons) Aegialitis annulata Partial shade 78 Exposed 54 Aegiceras corniculatum Shade 84 Exposed 44 Avicennia marina Partial shade 78 Exposed 43 Rhizophora stylosa Partial shade 75 Exposed 47 Sonneratia alba 80º leaf angle 78 47º 36
Range of water utilization in marine coastal mangroves in Florida (Sternberg)
Decrease in leaf area associated with osmotic concentration of leaf sap
Decrease of leaf conductance of several Rhizophora species in relation to salinity of water at the root level (Clough et al.)
Light dependence of CO2 uptake of mangrove species growing in hypersaline(Tacuato) and low (Ricoa) salinity sites (Watzka 1999)
Mangrove occurrence in wet and dry coastal habitats (after Walter & Steiner 1936)
Leaf characteristics of mangrove species from humid and dry habitats in north-eastern Venezuela Species Habitat Area SLA Osmolality Nitrogen Chlorophyll d13C cm2 m2 kg-1 --------------mmol kg-1------------- ‰ Laguncularia Humid 43.6 (2.5) 7.8 (0.4) 957 (52) 906 (43) 3.2 (0.2) -28.1 (0.2) racemosa (n=16-2) Dry 27.4 (9.4) 5.7 (0.4) 1712 (42) 864 (76) 2.3 (0.5) -25.4 (0.6) p= 0.05* 0.054 0.0001** 0.738 0.115 0.0005** Rhizophora Humid 83.2 (4.7) 6.5 (0.3) 1068 (38) 960 (46) 3.3 (0.3) -27.6 (0.4) racemosa + mangle Dry 51.3 (5.3) 5.3 (0.3) 1558 (64) 895 (82) 1.9 (0.4) -27.2 (1.1) (n=17- 4) p= 0.0026** 0.057 0.0001** 0.527 0.039* 0.693 Avicennia Humid 49.7 (6.0) 9.2 (0.4) 1253 (103) 1720 (143) 4.4 (0.4) -27.4 (0.5) germinans (n=8-8) Dry 24.2 (2.8) 6.8 (0.4) 1762 (141) 1488 (116) 3.4 (0.4) -25.6 (0.3) p= 0.0018** 0.0009** 0.012* 0.230 0.079 0.007**
Seasonal variations of gas exchange characteristics, cell sap osmolality and Na+ and Cl- content in Avicennia germinans and Conocarpus erectus growing in salt flats (From Smith et al. 1989). * Photosynthetic active radiation > 1 mmol m-2 s-1 Avicennia germinans Conocarpus erectus Rainy season Dry season Rainy season Dry season Osmolality (mmol kg-1) 1300 2650 760 1640 Cl- (mol m-3) 744 935 431 600 Na+ 261 891 154 504 K+ 130 107 49 35 Na+/K+ 2.0 8.3 3.1 14.4 Photosynthetic rate near saturation * (µmol m-2 s-1) 5.61 3.87 4.27 2.07 Total net CO2 uptake during the light period (mmol m-2 12 h-1) 173 105 133 40 Total transpiration per light period (mol H2O m-2 12 h-1) 101 31 154 8 Water-use efficiency during the light period 1.7 3.3 1.3 4.3 mol CO2 mol-1 H2O x 10-3
Dwarf and scrub mangroves: Salinity vs Nutritional Stress Dwarf mangrove forests of Rhizophora mangle in the Caribbean are associated to low availability of P (Feller 1995) Scrub mangrove communities of Avicennia germinans occur in low rainfall areas with interstitial water salinities 2-3 times larger than sea water
Nutrient concentrations (mmol m-2) of fresh leaves of Rhizophora mangle after two years of fertilization with NPK (10:15:15 as NH4:P2O5:K2O), P (0:45:0 as P2O5); N (45:0:0 as NH4(SO4)2) (Data modified from Feller 1995) Nutrient NPK P N Control C 8816 8691 10335 9904 N 224 201 249 211 P 6.0 5.0 3.4 3.4 K 31 33 77 71 Ca 78 85 116 106 Mg 45 49 73 67 Na 138 138 179 176 Leaf-water 154 153 183 183 g m-2 Leaf A/W 3.99 4.01 3.33 3.46 m2 kg-1
Thickness (µm) of tissue layers of leaves in basal and penapical stem positions on fertilized Rhizophora mangle trees after two years of specified treatments. In a row * numbers are significantly different from control (Feller 1996) Fertilizer treatments Leaf-tissue layers NPK P N Control Penapical leaf Cuticle 8 8 7 8 Upper epidermis 52 53 52 50 Hypodermis 183 194 229* 231* Palisade mesophyll 191 194 189 210 Spongy mesophyll 188 187 210 190 Basal leaf Cuticle 9 8 9 9 Upper epidermis 54 55 56 53 Hypodermis 225 208 572* 594* Palisade mesophyll 193 196 204 210 Spongy mesophyll 193 200 237* 236*