Download
1 / 53
530 likes | 537 Views
PSY 6430 Unit 4. Reliability and Validity. Lecture: Monday, 2/20 and Wednesday, 2/22 Exam: Monday, 2/27 SOs ME1: Wednesday, 3/01 ME1: Monday, 3/13, after semester break. Schedule. Make-up exam: Monday, 3/13, after break It will cover Units 1-4

E N D
PSY 6430 Unit 4 Reliability and Validity Lecture: Monday, 2/20 and Wednesday, 2/22 Exam: Monday, 2/27 SOs ME1: Wednesday, 3/01 ME1: Monday, 3/13, after semester break
Schedule • Make-up exam: Monday, 3/13, after break • It will cover Units 1-4 • I will hand out the study objectives Wednesday, 3/01 • I can’t give you the ME1 study objectives until I grade and hand back E4 on Wed., 3/01 • I want to give you your grades on ME1 before the last day to withdraw with academic penalty • But that means that Unit 5 lecture will be split, with lectures on 3/01 and 3/15, and the exam on 3/20
Make-up Exam • If you have missed an exam, you need to take this exam or your missing exam score will turn into a zero • If you have taken Exams 1-4, but would like to try to replace one of your scores with ME1, you should take the exam • If you get a lower grade on ME1, I will throw out the ME1 grade – ME1 can only help your grade, it cannot hurt it • If you are satisfied with your exam scores, you do not have to take the exam – you get the day off!
Unit introduction • I have found that students cannot understand reliability and validity unless they first understand correlation • Thus, I am first going to review correlation and statistical significance before dealing with reliability and validity • In traditional I/O psychology programs, students would be required to take a generic tests and measurements course before taking a course in personnel selection, but since our program does not emphasize testing, we don’t have that type of course • Unfortunately, Gatewood, Feild, & Barrick discuss correlation in some detail as it relates to validity, but don’t talk about it much before they discuss reliability; yet correlation is the primary way to determine reliability as well • I could not find relevant supplemental material that dealt with this topic the way I wanted to deal with it in this course, so bear with me a bit
SO1 (NFE): Correlation, validity, and reliability of selection instruments • A correlation coefficient indicates • whether two variables are related and • the extent to which they are related • Correlation is typically used in selection to determine whether • the scores on a selection instrument are really measuring what you want to measure (do the scores actually reflect the KSAs you want to measure and the person’s competence) • your selection instruments are related to how well a person performs on the job • Reliability refers to whether the selection instrument is accurately measuring the knowledge, skill and/or ability it is supposed to be measuring • Validity refers to whether your selection instruments are related to the job
SO1 (NFE): Correlation and reliability • With respect to reliability, correlation is used to answer the following questions: • Is the selection instrument accurately measuring the ability, skill, or knowledge it is supposed to be measuring • Does the person’s score accurately reflect his/her competence with respect to what is being measured • Reliability does not indicate whether the selection procedure is related to performance on the job
SO1 (NFE): Correlation and reliability • One measure of reliability is the stability/consistency with respect to how a person scores when he/she takes the test two different times • In order to be useful for selection, the score a person receives must be reasonably the same each time he/she takes the test Example: Assume that math is required to perform well on the job. A company administers a math test, and a person gets a 75. If the same person took the test the next day and only scored a 20, the test would not be useful for selection purposes. Why? Because you would not know whether the 75 or 20 represented what his/her math skills really were. • A high correlation between test scores indicates that the test is “reliable”
SO1(NFE): Correlation and validity • With respect to validity, correlation is used to answer the following two questions: • Is the score that a person receives on a personnel selection instrument related to a measure of his or her job performance? • If so, to what degree are the two related? • If scores on the selection instrument and the measures of job performance are highly correlated, then the selection instruments • are considered to be related to the job and • can be used to select individuals for the job in the future
SO2: Some basic terms • SO2: Terms related to correlation • r = correlation coefficient • x = selection test/instrument • y = measure of job performance • rxy = validity correlation coefficient; that is, the correlation between a selection test and measure of job performance • rxx = reliability correlation coefficient; that is, the correlation between two administrations of the same test or two tests that measure the same thing (alternate forms of the same test)
SO3: Some basic terms, validity • SO3: Terms related to validity • Predictor = selection test/instrument; you use the score on the selection test to predict job performance • Criterion = measure of job performance
SO4A: Elements of a correlation • 4A. Two elements of a correlation coefficient • Magnitude: how strong the relationship is • Sign, + or -: whether the relationship is positive or negative • 4A. Magnitude and sign • Correlations go from -1 to +1 • -1 indicates a strong negative relationship • +1 indicates a strong positive relationship • 0 indicates there is no relationship • How would you rank order the following correlations in terms of magnitude? -.20, +.05, +.15
SO4B: Inverse relationship • 4B. If there was an negative or inverse relationship between the scores on a social skills test and performance measures for computer programmers, what would that mean? (next slide for diagrams of positive/negative relationships)
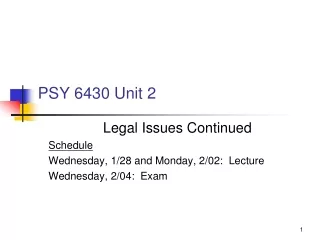
High High Performance Performance Low Low Low High High Low Test Test SO5: Fairly high positive, fairly high negative and zero relationship between test scores and measures of performance • High positive relationship • People with good test scores perform well • People with poor test scores don’t perform well • Thus, if you knew a person’s test score but you didn’t know what his performance score is, you could make a good guess what his performance is • High negative relationship • People with good test scores don’t perform well • People with poor test scores perform well • Once again if you knew a person’s test score, you could guess what his performance was • Zero relationship • Some people with good test scores perform well but just about as many do not perform well • Some people with poor test scores perform well but just about as many do not perform well • If you know a person’s test score, but don’t know the person’s performance score, you could not guess what his performance was High Performance Low Low High Test
SO6: NFE, but possible confusion • You determine the validity of a test using current employees • Administer the test to them and then collect measures of performance and correlate them • If the correlation coefficient is statistically significant, we conclude that the test is job related • You then administer the test to a group of job applicants • You now have scores from the test for the applicants but you do not have measures for job performance (you haven’t hired them yet) • You use the scores from the test to predict how well the person will do on the job, based on the validity coefficient from your current employees
SO7: Statistical significance The correlation between the test scores and the performance measures must be statistically significant at the .05 level in order for the selection test to be considered a valid predictor of job performance. If it is not, then the selection test is not considered to be a valid predictor and you should not use it to select applicants.
SO8: Statistical significance • Descriptive vs. inferential statistics Assume you have ten current employees. You administer a test to them and correlate the test scores with a measure of job performance. The resulting correlation is .50. If we are concerned only with the performance of these particular 10 employees, we can accept this correlation as a completely accurate description of the degree to which the test scores are related to their job performance measures. (descriptive statistics) However, in selection we are not just interested in these particular 10 employees. Rather, we want to know if we can use the test scores to predict the job performance of others (future applicants). (inferential statistics) (for those of you who just had 6340, this should be easy – the book is a little misleading- not wrong, but misleading)
SO8: Statistical significance The question becomes: Is the test related to job performance for all potential employees (the entire population of employees), not just for your particular 10 employees (the sample). Your ten employees constitute only a very small sample of that whole “population” of potential employees. Clearly if we took another 10 employees, administered the test to them and correlated the scores with their job performance measures, the correlation would not be the same - it might be higher, it might be lower. Given that the correlation would not be the same for another group of employees, how do we know that the test is actually valid? That is, is actually related to performance? That is what statistical significance tells us. The question asked is rather simple: Given the correlation (.50) we obtained with our particular sample (our 10 employees), what are the chances that the real correlation between the test and performance measure is actually zero?
SO8: Statistical signficance • What we mean when we say that a correlation is significant at the .05 level (three critical parts): • The chances are not greater than 5 out of 100 that the correlation for the whole population of employees is zero given that • We obtained the correlation we did (in my example, .50) or larger • For our sample which contained a specific number of individuals (in my example, 10 individuals) In other words, what are the chances we are wrong? What are the chances that the validity coefficient for the entire population of employees is really zero, given that we obtained a correlation coefficient of .50 based on our 10 employees? If our correlation of .50 was significant at the .01 level, what would that mean? (click for question)
SO8: Statistical significance • To determine whether a correlation is statistically significant for the number of employees in your sample, you consult a statistical significance table (I have provided a sample at the end of the study objectives) • In order for a correlation coefficient to be statistically significant at the .05 level with a sample size of 10, the correlation must be at least .63 • Thus, my correlation is not statistically significant • The chances are greater than 5 out of 100 that we are wrong; that is, the chances are greater than 5 out of 100 that the actual correlation between the test and the performance measure for the population of employees is actually zero • Thus, we must conclude that the test is not job related and will not predict the job performance of applicants • It is NOT valid
SO9: What statistical significance does not mean 9A Statistical significance tells us nothing about the real magnitude or size of the correlation It does not mean that the true correlation between the test and performance scores is the correlation you obtained with your sample or even approximates that correlation It simply means that there is a 95% probability that the correlation is not zero. 9B It does not mean that if you correlated the test scores and performance measures for different samples, there is a 95% probability that you would obtain the same correlation (in my example, .50) It simply means that there is a 95% probability that the correlation is not zero. (Assume, .50 correlation that was statistically significant at .05)
SO11: Sample size and reliability of the correlation 11A A correlation coefficient is less reliable with small sample sizes. What does this mean? The size of the correlation is going to vary more if your sample size is small; it will be less stable from sample to sample That is, if you correlated the test scores with performance measures for four groups of 10 employees each, the size of the correlation is likely to be quite different for the four groups, and differ more in size than if you correlated the test scores with performance scores for four groups of 50 employees each.
SO11: Sample size and reliability of the correlation 11B Why are correlations less reliable with small sample sizes? A larger sample means the correlation you obtain is going to be more reliable because you are sampling a greater number of individuals from the population. With smaller samples, the correlation is going to differ more from sample to sample because of sampling errors - you may have one or two “unusual” cases. For example, assume that your total population is 100 (not theoretically possible or correct). If you correlate the test scores with the performance scores for 90 of those individuals, you would expect a more reliable correlation than if you correlated them with a sample of 5, 10, or even 50.
SO12: Statistical significance and size of the sample • As the sample size decreases, the correlation required to achieve significance increases. Why? Because correlations based on small sample sizes are unreliable. The size of the correlation is going to vary more across samples if you use a small sample size. Because of that variation, the magnitude of any one correlation coefficient from any one sample must be larger to be statistically significant to compensate for the fact that the correlation from that sample may, indeed, be wrong. More technically, the correlation may not be representative of the true correlation for the entire population. (highly related to the preceding material; first sentence is not adequate for the exam)
NFE: Statistical significance and sample size While reliability coefficients often range from .80 to the mid .90s, validity coefficients rarely exceed .50. They often range from .30-.50, but can even be much lower than that.
SO13: Sample size and validity coefficients • Regardless of the reason, what is wrong with a small sample size when correlating test scores with performance measures? As the sample size decreases, the probability of not finding a statistically significant relationship between the test/predictor and the criterion (performance measure) increases. Thus, you are much more likely to conclude that your test is not valid and hence not useful, when in fact it may well be.
SO14: Study by Schmidt • Frank Schmidt correlated scores from a clerical test with performance measures for 1,500 post office letter sorters • The correlation for the entire sample was .22 • The correlation was statistically significant • He and his colleagues then divided this sample up into 63 groups of 68 individuals each (68 = most common size of group for a validation study) • Validity coefficients ranged from -.03 to .48! • Less than a third were statistically significant! Validity coefficients may be very misleading with small (?) sample sizes and lead to the conclusion that your test is not valid when in fact it is or vice versa!! (terrific study! Demonstrates how size of the correlation can vary from sample to sample; Frank Schmidt is one of THE names in selection; click, implications; valid when it is not: ~.25 correlation, sig at .05 level for 68; next slide - reliability)
SO15: Reliability • Fundamental definition The degree of stability, dependability, or consistency, scores on a measure (either the test or the performance measure) • (NFE) Essence of Reliability To what extent does the score reflect the person’s ability vs. the extent to which the score reflects measurement error • Is the instrument accurately measuring the KSA it is supposed to be measuring? • Does the person’s score accurately reflect his/her competence with respect to what is being measured?
SO15: NFE but confusion about reliability • Reliability is a theoretical concept that must be operationally defined • Because of that, there are different ways to assess it In behavior analysis, for example, interobserver agreement is a form of reliability: are you consistently and accurately measuring the behavior you say you are measuring? • Are your definitions of behavior adequate? • Are your observers accurately measuring the behavior? • Are you using the right sampling procedure? • Frequency count, whole interval, partial interval, time sampling? • The data you obtain consists of the “true” measure of behaviors and the “errors” that creep in because of measurement error due to the above (related to SO16) • Just as in selection you can conceive of your data having two “parts”: True measure of behavior + the error
SO15: Reliability • With respect to selection instruments, there are three primary ways to operationalize “reliability” • Stability • Dependability • Consistency
SO15: Reliability • Stability Does the person get approximately the same score if he/she takes the test several times? • Dependability Does the test accurately sample the relevant content? That is, is it measuring what it is supposed to be measuring? For example, does a math test give an accurate indication of a person’s mathematical ability or is there something wrong with some of the items on the test? • Consistency Are the items on the test measuring the same thing? Do all of the items on a mechanical ability test measure mechanical ability?
Introduction: NFE • Four basic ways to assess reliability • Test-retest, with a time delay in between • Parallel forms, no time delay • Parallel forms, with a time delay in between • Internal consistency, split half reliability
SO17: Test-retest reliability • 17A: Test-retest reliability, what is it? • The same test is administered twice to the same individuals, with a time interval in between • The scores are then correlated • 17B: Resulting coefficient is called what, and why? • coefficient of stability • It measures how stable the scores are on that test over time • A KSA should remain stable, given that no learning has taken place • 17C: What does it indicate? • How stable the score is over time
SO18: Test interval for test-retest method • 18A: Why is an interval that is too short inappropriate? • Memory - the person can remember the items and how he/she responded the first time • 18B: Will an interval that is too short underestimate or overestimate reliability? Why? • Overestimates it • A person is likely to get the same or a similar score because he/she remembers the items, not because the test shows good stability over time
SO19: Test interval, for test-retest method • SO19: In general how long should the interval be? • Several weeks (3-4 weeks) to several months • However, long intervals (6 months or so) can also get you into trouble
SO20: Test interval, for test-retest method • 20A: Why is an interval that is too long inappropriate? • Learning may occur during the interval - the person’s KSA may actually change during that time period • 20B: Will an interval that is too long underestimate or overestimate reliability? Why? • Underestimates it • A person is going to score differently on the test because his/her competency on the KSA has changed, not because the score on the test is not stable over time • If the person hadn’t acquired more competency, the person may have gotten the same score • Also relevant to the alternate or parallel form method of reliability if an interval is used (math ability - may have had a class in math)
SO21: Test-retest reliability • Test-retest reliability is appropriate if you are interested in whether a measure is stable over time • If a measure has high test-retest reliability (.85 or above), you can conclude that the test is free from error associated with passage of time • *If a measure has low test-retest reliability (below .85), however, you would not know whether • The test actually has low reliability - test suffers from error due to passage of time • The low correlation is due to the fact that the KSA being measured has actually changed (and hence your test may actually be reliable) *this part, NFE
SO22: Parallel forms reliability • Parallel/alternate/equivalent forms reliability, what it is? • Two different tests that measure the same thing are administered to the same individuals with no (or a very short) time interval or a time interval in between • Two arithmetic tests that are designed to measure the same thing but have different problems • Two clerical proofreading tests that are designed to measure the same thing but have different items • How is the reliability determined? • Correlate the test scores from the two tests
SO22, cont: Parallel forms reliability • If no time interval, or a short interval, what is the reliability coefficient called? Why? • Coefficient of equivalence • It indicates the consistency with which the KSA is measured by the two instruments • Conceptually, it tells you whether your test is actually measuring what it is supposed to be measuring - the underlying KSA being assessed by the two measures • If the coefficient is high (.85 or higher): add this for the exam • You can conclude that the two tests are consistently measuring what they are supposed to be measuring
SO23: Parallel forms with a time interval in between reliability • What is the reliability coefficient called? Why? • Coefficient of equivalence and stability • It indicates the consistency with which the KSA is measured by the two instruments • It also indicates whether the scores are stable over time (small warning – students often miss this when I ask it on the exam; another slide on this)
SO23: Parallel forms with a time interval in between reliability • If the coefficient is high (.85 or higher): • You can conclude that the two tests are consistently measuring what they are supposed to be measuring AND • The scores are stable over time • If the coefficient is low, however, you don’t know whether: • The two tests are not equivalent - they are not measuring the same thing but again you don’t know which test is not measuring what it is supposed to be measuring (or whether neither is measuring what it is supposed to be measuring) • The scores are not stable over time • Some combination of the above (if things work out, you know more than just test-retest or parallel forms w/o interval, but if not, then you are left wondering what the problem is)
SO25: Parallel forms vs. Test-retest • In general, does parallel form method tend to underestimate or overestimate reliability? • Tends to underestimate it • Why? • In practice, it is VERY difficult to develop two identical tests • Which method is better? • If you can obtain equivalent forms, parallel form is almost always preferred • Why? • Because scores would be the same if individuals took an equivalent test at a different time • That is, the test is measuring what you think it is, and the scores are stable over time
SO26: Internal consistency • What is internal consistency and what does it show ? It shows the extent to which items on the same are measuring the same thing • Let’s say you have an arithmetic test with 10 items • If each item is truly measuring a person’s arithmetic ability, and the person gets one of the problems right, he/she should, theoretically, get of the other nine right as well • On the other hand, if he/she misses one of the problems, he/she should miss the other nine as well (next slide on this as well)
SO26: Internal consistency • Internal consistency is only good for unidimensional tests - that is, for a test in which all of the items are supposed to be measuring the same thing • It is not appropriate for multidimensional tests - tests that measure different KSAs in one test • Why? A person might do well on one KSA, but not the other because of his/her different competencies on the two KSAs (last slide on this)
SO27: Statistical interpretation of a reliability coefficient • Let’s assume you administered the same exam to the same individuals with an interval in between and correlated the scores • The resulting correlation coefficient is .90 • How is that statistically interpreted? 90% of the differences in the scores between the individuals who took the test is due to “true” differences in ability, while 10% is due to measurement error
SO28: Minimum and preferred reliability correlation coefficients • Minimum = .85 • Preferred = at least .90 • Why? • You are correlating a measure with itself • If the measure does not correlate with itself, it cannot correlate with something else (job performance) • As you will see next unit, if a test is not reliable it cannot be valid (although it can be reliable and not be valid) • That is, if the test is not reliable it cannot be related to the job and you cannot use it to select applicants (authors don’t give a figure; depends on the situation – rule of thumb)
SO29: Generally, how do differences between individuals affect reliability estimates • In general, the greater the differences between individuals on the KSA being measured, the higher the correlation • This may seem counterintuitive, but remember in order to have a high positive correlation: • High performers must perform well on both tests • Middle performers must perform middling on both tests • Low performers must perform low on both tests • Thus, you need to have a range of scores (high, medium, and low) in order to get a strong correlation • Anything that restricts/reduces the range of scores on either test will, in general, decrease the magnitude of the correlation (example on the next screen)
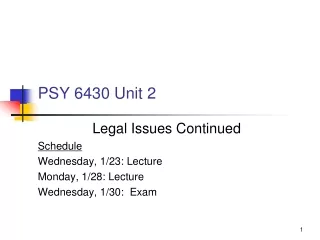
Test, Time 2 Low Low High High Test, Time 1 High High Test, Time 2 Low Low Test, Time 1 • You administer a math test to high school students, community college students, and college engineering students • You re-administer the same math test to the same individuals • The high school students score relatively poorly on both administrations of the test, the cc students middling, while the college engineering students score much better on both administrations of the test • When you plot the scores you get the diagram on the right, which represents a high positive correlation • Now, let’s give the test to only college engineering students and redraw the diagram (assume the circled data points represent the scores of the engineering students in both diagrams) • You still have a low positive correlation between the two test administrations, but it is not as strong or nearly as high of a correlation
29B: Why from a statistical perspective? • Correction to the study objective: the answer is in 130,1 not 131,1. • Variation between individuals represents differences in the ability • Variation within an individual represents error • Therefore, if variation increases between individuals while variation within an individual stays the same, the correlation/reliability will be higher
SO30: Length of the test and reliability estimates • In general, as the length of the test increases, so too will the reliability. Why? Think of a test that is designed to measure mathematical ability. The items on the test are only a sample of all possible items. If you have 5 math problems, a person may miss one just because of error (i.e., misread a 2 as a 5, or made a “stupid” error because he/she was hurrying, etc.). The more problems you have, the more likely it is that the person’s score will actually represent his/her “true” ability; he/she can make one or two errors “by mistake” without having it affect the person’s overall score on the exam as much. • Behavior analysis analogy With within-subject data, the more data points you have for an individual during each phase, the more confident you are that the data actually represent the person’s true performance under that condition, not simply momentary fluctuations due to unknown factors in the environment