Download
1 / 22
220 likes | 223 Views
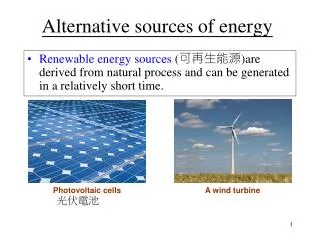
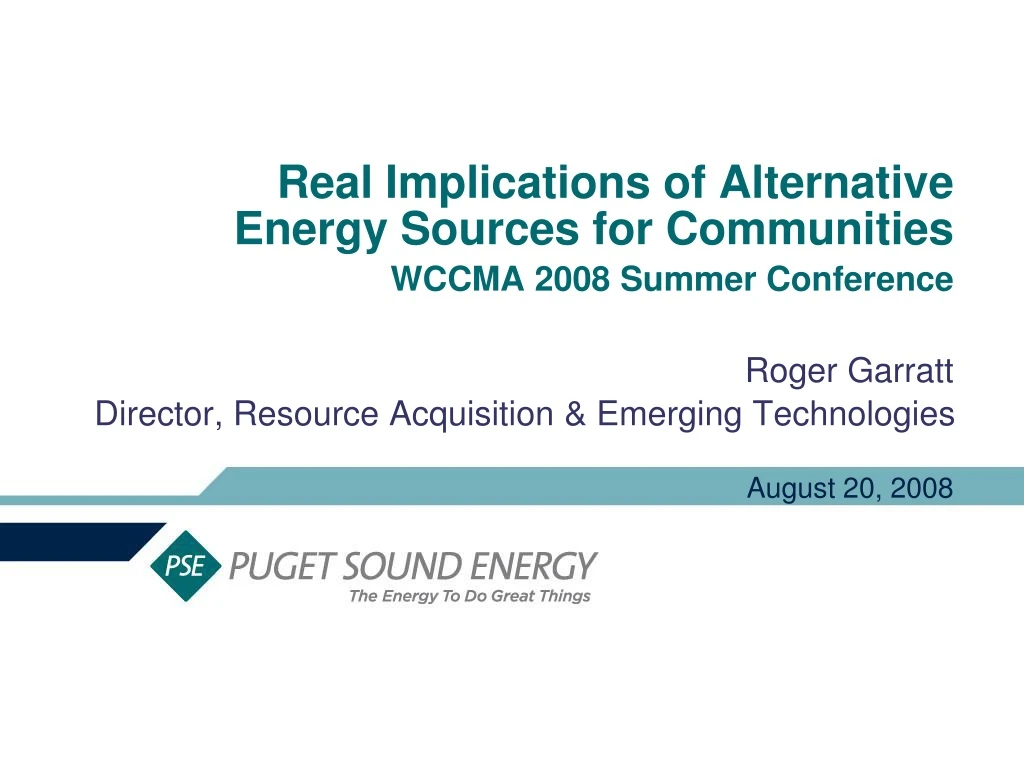
Real Implications of Alternative Energy Sources for Communities WCCMA 2008 Summer Conference. Roger Garratt Director, Resource Acquisition & Emerging Technologies. August 20, 2008. Agenda. PSE Overview PSE Renewable Resources Market Overview Community Benefits Conclusions.

E N D
Real Implications of Alternative Energy Sources for Communities WCCMA 2008 Summer Conference Roger Garratt Director, Resource Acquisition & Emerging Technologies August 20, 2008
Agenda • PSE Overview • PSE Renewable Resources • Market Overview • Community Benefits • Conclusions
PSE, a Washington Company • State’s oldest and largest utility, serving more than half of State’s population • Over 1 million electric customers • Over 700,000 natural gas customers • Added 56,000 customers in last two years • Public Service Company with an obligation to serve Sample
PSE Energy Need *Energy need before conservation, includes new contracts, new wind and hydro shapes, and Sumas
PSE Resource Strategy *Lowest Reasonable Cost Resource Portfolio, from May 2007 Integrated Resource Plan
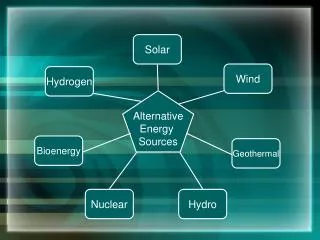
New Renewables Renewables Strategy
Renewables development is booming Source: Renewable Northwest Project
LM Glasfiber Little Rock, AK & Grand Forks, ND Gamesa Philadelphia, Pennsylvania Vestas Windsor, Colorado Trinity Structural Towers Clinton, IL & Fort Worth, TX PPG Industries Shelby, North Carolina Knight & Carver Howard, South Dakota TECO-Westinghouse Round Rock, Texas DMI West Fargo, ND & Tulsa, OK Clipper Windpower Cedar Rapids, Iowa Both facilities manufacture blades for wind turbines. All three facilities (2 US and 1 Canada) manufacture wind towers. Manufactures 130- and 144-foot long blades for 1.65 and 3 MW turbines Manufacture and assembly of 2.5-MW Liberty wind turbines and spare parts for support services Multiple plant sites manufacture turbine parts, nacelles and towers for G80, G83, G87 and G90 2 MW machines.. Facility produces high-tech fiberglass for blades; PPG also produces blade and tower coatings Assembles nacelles, using Composite Technology’s DeWind brand turbines; and also produces the rotor hub. Blade construction and repair facility Both facilities manufacture wind towers that support turbines as large as 2.5 MW. Fuhrländer (Proposed) Helena, Montana Will manufacture 2.5 MW AG wind turbine, which has 150-ft. blades Rise in Wind Component Manufacturers in the U.S. Note: Map is illustrative only; it is not intended to be a representation of all wind component manufacturing in the U.S.
$8 million – to local community during construction $1.3 million – 2008 property taxes Hospital $45,000 Local schools $556,442 County $345,248 State $369,156 Lease and royalty payments to state agencies: WDFW $80,000 DNR (schools) $306,000 Economic Benefits – Wild Horse
Tourism • Renewable Energy Center - over 10,000 visitors since opening April 1, 2008 • Guided Tours – over 125 tour groups
Conclusions • Renewable resources are consistent with public interests • Environmental benefits • Sustainability • Energy independence • Community members “connect” with renewable resources • Over time, renewables will become more and more prevalent
Rising Wind Project Costs Rising Installed Wind Project Costs Rising Turbine Costs Charts Source: Thorndike Landing analysis Wind turbines comprise 60% of total project costs.
Additional transmission investment required Summer Transfers Winter Transfers Constrained Transmission Path
Proof of Concept Early Commercial Favorable High Market Economics Favorable Mass Market Economics Concept Pilot Tidal Wave Algae CSP - PV CSP Solar Thermal Electric PHEV Biomass Gasification Batteries Technology Development Solar PV Dairy Digester Fuel Cells Wind Traditional Biomass Geothermal
Hopkins Ridge Wind Facility • 157 MW • November 2005 service date • Four new units added in 2008 • 87 Vestas V80 1.8 MW turbines • ~1,069,000 MWh generated
Wild Horse Wind Facility • 229.6 MW • December 2006 service date • 127 Vestas V80 1.8 MW turbines • Over 1,058,000 MWh generated • 22-unit expansion planned for 2009-2010
Wild Horse Solar Facility • 500 kW Facility • 450 kW Phase I • October 2007 service date • 573 MWh generated • 5-acre footprint • $4.5 million capital cost
Klondike III Power Purchase Agreement • 223.6 MW Facility • 50 MW PSE share • 80 GE 1.5 MW, 44 Siemens 2.3 MW, 1 MHI 2.4 MW • Owned/operated by PPM Energy • December 2007 service date