Download
1 / 48
480 likes | 502 Views
Chapter 6. Control Charts for Variables. Subgroup Data with Unknown and . Phase I Application of and R Charts. Equations 5-4 and 5-5 are trial control limits. Determined from m initial samples. Typically 20-25 subgroups of size n between 3 and 5.

E N D
Phase I Application of and R Charts • Equations 5-4 and 5-5 are trial control limits. • Determined from m initial samples. • Typically 20-25 subgroups of size n between 3 and 5. • Any out-of-control points should be examined for assignable causes. • If assignable causes are found, discard points from calculations and revise the trial control limits. • Continue examination until all points plot in control. • Adopt resulting trial control limits for use. • If no assignable cause is found, there are two options. • Eliminate point as if an assignable cause were found and revise limits. • Retain point and consider limits appropriate for control. • If there are many out-of-control points they should be examined for patterns that may identify underlying process problems.
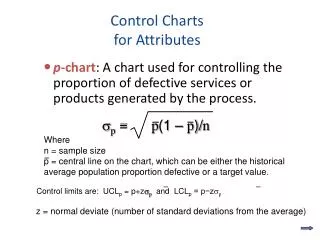
Assume spec tolerance is 1.5 +/- 0.5 micron. Nonconformance probability:
Cp: Process Capability Ratio (PCR) P : % of specification band the process uses up. P can be estimated as:
Revision of Control Limits and Center Lines • Effective use of control charts requires periodic review and revision of control limits and center lines. • Sometimes users replace the center line on the chart with a target value. • When R chart is out of control, out-of-control points are often eliminated to re-compute a revised value of which is used to determine new limits and center line on R chart and new limits on chart.
Phase II Operation of Charts • Use of control chart for monitoring future production, after a set of reliable limits are established, is called phase II of control chart usage (Figure 5-4). • A run chart showing individuals observations in each sample, called a tolerance chart or tier diagram (Figure 5-5), may reveal patterns or unusual observations in the data.
Control vs. Specification Limits • Control limits are derived from natural process variability, or the natural tolerance limits of a process. • Specification limits are determined externally, for example by customers or designers. • There is no mathematical or statistical relationship between the control limits and the specification limits.
Rational Subgroups • charts monitor between-sample variability. • R charts measure within-sample variability. • Standard deviation estimate of used to construct control limits is calculated from within-sample variability. • It is not correct to estimate using
Guidelines for Control Chart Design • Control chart design requires specification of sample size, control limit width, and sampling frequency. • Exact solution requires detailed information on statistical characteristics as well as economic factors. • The problem of choosing sample size and sampling frequency is one of allocating sampling effort. • For chart, choose as small a sample size consistent with magnitude of process shift one is trying to detect. For moderate to large shifts, relatively small samples are effective. For small shifts, larger samples are needed. • For small samples, R chart is relatively insensitive to changes in process standard deviation. For larger samples (n > 10 or 12), s or s2 charts are better choices. • NOTE: Skip Section on Changing Sample Size (pages 209-212)
Charts Based on Standard Values D1 = d2 - 3d3 D2 = d2 + 3d3 d2 : mean of distribution of relative range d3 : standard deviation of distribution of relative range
An assumption in performance properties is that the underlying distribution of quality characteristic is normal. • If underlying distribution is not normal, sampling distributions can be derived and exact probability limits obtained. • Usual normal theory control limits are very robust to normality assumption. • In most cases, samples of size 4 or 5 are sufficient to ensure reasonable robustness to normality assumption for chart. • Sampling distribution of R is not symmetric, thus symmetric 3-sigma limits are an approximation and -risk is not 0.0027. R chart is more sensitive to departures from normality than chart. • Assumptions of normality and independence are not a primary concern in Phase I.
Operating Characteristic (OC) Function σ is known. In-control mean: μ0 out of control mean: μ1 = μ0 + kσ Probability of not detecting shift: β-risk L: number of σ’s For L = 3, n = 5, k = 2.
Average run length (r): shift is detected in the rth sample. In the example. Expected number of samples for detecting shift = 4.
For Shewhart control chart: Average time to signal (ATS) Average number of individual units sampled for detection (I)
Sometimes it is desired to use s2 chart over s chart. The parameters for s2 chart are:
Shewhart Control Chart for Individual Measurements What if there is only one observation for each sample. Use the moving range between two successive samples for range.
Use the d2, D3 and D4 values from n = 2 row for individual measurements. Then:
Average Run Lengths • ARL0 of combined individuals and moving-range chart with conventional 3-sigma limits is generally much less than Shewhart control chart. • Ability of individuals chart to detect small shifts is very poor.
Normality • In-control ARL is dramatically affected by nonnormal data. • One approach for nonnormal data is to determine control limits for individuals control chart based on percentiles of correct underlying distribution.