Download

1 / 16
160 likes | 163 Views
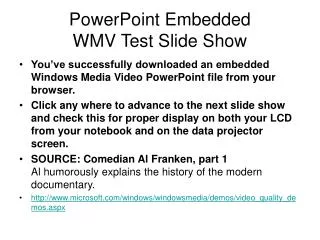
Learn how to use embedded visuals in PowerPoint presentations to create exciting and impressive slide shows. Discover tips and solutions to find the right graphics and enhance your message effectively.

E N D
Using Embedded Visuals to Enhance a Slide Show By Viridiana Robles
Creating Exciting Presentations Using Embedded Visuals • The starting point for a presentation is using bulleted lists and simple graphics. • PowerPoint allows you to create exciting presentations which are used to impress the audience.
A problem • While developing a presentation, it can sometimes be difficult finding the proper graphic to express your message. • Two Solutions to this problem are: • to solve this is to modify clip art from the Microsoft Clip Gallery • to create a table.
Importing Text Created in Another Application • Opening an outline created in another application • Changing presentation design templates • Changing the font • Saving the presentation
Ways of Creating and Embedding an Organization Chart • First, display the slide that will contain the organization chart. • Next, change the AutoLayout to the Organization Chart AutoLayout. • Then, open the the Microsoft Organization Chart application. • Last, enter and format the contents of the boxes in the organization chart window.
Ways of Creating and Embedding an Organization Chart (Cont.) • Changing slide layouts • Click the Next Slide button on the scroll bar in order to display Slide 3. • Then click Slide Layout (on the Common Tasks button menu). • Once the dialog box appears, type the number 7 to select the Organization Chart AutoLayout from the 24 Layouts. • Finally, click on the Apply button.
Ways of Creating and Embedding an Organization Chart (Cont.) • Microsoft organization Chart is composed of : • A Manager box • Located at the top of the chart • The topmost manger is called the root manager (identifies the purpose of the organization Chart) • Subordinate boxes • Located at a lower level than its manager
Ways of Creating and Embedding an Organization Chart (Cont.) • Adding subordinate boxes • The Microsoft Organization Chart contains five types of boxes which are: • Subordinate box • Co-worker box • Co-worker box (different from the other co-worker box) • Manager box • Assistant Box
PowerPoint allows you to add shadow effects to boxes in an organization chart. It also allows you to change border styles in an Organization Chart. You can also scale an Organization Chart Object. It also helps you move the Organization Chart. Ways of Creating and Embedding an Organization Chart (Cont.)
You can also scale an Organization Chart Object. • To Insert a table into a slide, you have to: • Click the Next Slide button (on the scroll bar) • Next, click the Common Tasks button (on the formatting toolbar) • Then, click on Slide Layout. • Last, Double-click the Table slide layout in row 1 of the table.
To format a table, you have to add borders. It helps draw attention to the object by defining its edges. A border has two different lines. Line Style Determines the line thickness and line appearance of the border. Line Color Determines the color of the line that forms the border. Table
Table (Cont.) • It is also helpful to add color to the lines of the border to attract more attention to the table. • Two ways to do this is by: • Line color • Fill color
PowerPoint Clip Art Object • PowerPoint allows you to insert a Clip art picture from the drawing toolbar. • It also allows you to scale and move a clip art picture. • It can also ungroup a clip art picture. • PowerPoint allows you to deselect clip art objects. • You can also delete a PowerPoint object.
Adding Slide Transition and Text Preset Animation Effects • To add slide transition and text preset animation effects • Click the Slide Sorter View button on the bottom-left side of the window. • While holding down the Shift key, click slide 2 and release the shift key. • Click the Slide Transition effects arrow and click Strips Right-Down • Click the Preset Animation box arrow and click on Zoom In From Screen Center.
Adding Slide Transition and Text Preset Animation Effects • To print slides as handouts • On the menu bar, click File and click Print. • Click the Print what box arrow and click Handouts. • Click on Pure Black and White and click the OK button.