Download
1 / 28
280 likes | 479 Views
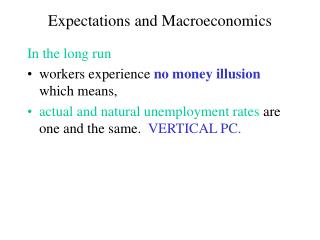
ECN202: Macroeconomics. 1920s: Classical Economic Theory and Policy "Fashions in economic ideas come and go, like fashions in women's clothes....the history of economic thought is closer to the history of women's fashion than to the history of astronomy or physics.". The Classical View.

E N D
ECN202: Macroeconomics 1920s: Classical Economic Theory and Policy "Fashions in economic ideas come and go, like fashions in women's clothes....the history of economic thought is closer to the history of women's fashion than to the history of astronomy or physics."
The Classical View The central element in the Classical Model is efficient markets so that any disequilibrium is quickly eliminated. In the domestic capital market any imbalance between the supply and demand for funds, which are our savings and investment, will be eliminated by a change in the interest rate. Any imbalance in the foreign exchange market resulting from trade imbalances will be eliminated by the flow of gold and price level changes. And any disequilibrium in the labor market – unemployment – will be eliminated by flexible wages so we always end up at full employment. This shows up with the AS-AD curve as a vertical AS curve and this means that any change in AD has no impact on equilibrium income – what they call Crowding Out. Now you can look at the pieces of the model.
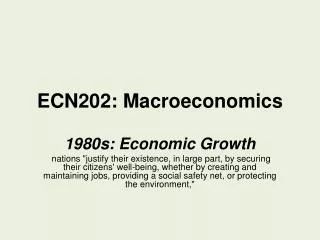
The American system: What it does "the greatness of America has grown out of a political and social system and a method of control of economic forces distinctly its own - our American system - which has carried this great experiment in human welfare further than ever before in all history. We are nearer today to the ideal of the abolition of poverty and fear from the lives of men and women than ever before in any land."Herbert Hoover Oct 22, 1928
The American system: What makes it work "Liquidate labor, liquidate stocks, liquidate the farmers, liquidate real estate. … It will purge the rottenness out of the system. High costs of living and high living will come down. People will work harder, live a more moral life. Values will be adjusted, and enterprising people will pick up from less competent people."
The American system: the pieces To understand the Classical model we start with the National income Identity (AS = AD) and then with a little rearranging • (S-M) = represents supply and demand in the domestic capital market (S = Savings (supply of funds), I = Investment (demand for funds)) • (X-M) - represents supply and demand in the foreign capital market (M = Imports, X = Exports) = trade deficit • (T-G) – represents the government budget surplus (deficit) (T = Taxes, G = Government outlays). If markets “force” S=I and M=X, then T = G, which “proves” the government should balance its budget.
The Classical Model:A Starting point National income equilibrium V1. Y = C + I + G + X - M National income equilibrium V2. (I - S) + (X - M) = (T - G)
Domestic Balance (I - S) =0? Market for loanable funds / money S = Savings (supply of funds) – as rates rise more will be saved I = Investment (demand for funds – as rates rise less will be borrowed • What happens @ r1 • What happens @ r* S r* r1 I Now let’s look at two examples.
Domestic Balance (I - S) =0? Show how to translate the words into the graph. What happens as boomers age and buy more bonds (increase savings)? r*
Domestic Balance (I - S) =0? Show how to translate the words into the graph. What happens as businesses lose confidence in the economy? r*
International Balance (X-M) =0? The words We trace through the chain of events that link the trade deficit through flows of gold to money supply to price levels and then the circle closes when this affects the trade deficit by impacting exports and imports. In the next slide the links in the logic are presented. A key to the logic is the purchase of products where there are international alternatives. Here you can look at the choice of a domestic or foreign product to see how it works.
Where do you make the purchase? Where do you buy the computer? $1,000 in US or 600 € in Europe? 1. Find exchange rate • Exchange rate = $1 = .78 € or 1 € = $1.27 2. Convert into common currency $1,000 = 788 € > 600 € = buy in Europe 600 € = $782 < $1,000 = buy in Europe
International Balance (X-M) =0?The words • Link between currency and gold (gold prices for each currency) • Link between international trade and gold supply (people want to be paid in gold) • Link between gold supply and money supply (money is backed by gold) • Link between money supply and prices (more money = higher prices) • Link between prices and trade balance (higher prices = fewer exports & more imports)
International Balance (X-M) =0?The logical chain BOT (X-M) Gold supply money supply Price level BOT (X-M)
International Balance (X - M) 1. Link between currency and gold Establish 1 oz of gold = $20 Establish 1 oz of gold = 10£ • 20$ = 10£ • 2$ = 1£ • $ = 1/2£
International Balance (X - M) 2. Link between trade and gold 1 oz of gold = $20 = 10£ 1 shirt = $20 or 15£ 1 shirt = __ oz of gold in UK and __ oz of gold in US UK US Fill in the table
International Balance (X - M) 2. Link between trade and gold 1 oz of gold = $20 = 10£ 1 shirt = $20 or 15£ 1 shirt = __ oz of gold in UK and __ oz of gold in US UK US How does this compare with yours?
International Balance (X - M) 2. Link between trade and gold summary • 1 shirt = 1.5 oz of gold in UK and 1 oz of gold in US • Shirt cheaper in US so UK shoppers buy in US • US has BOT surplus (X > M) • Gold flows into US because of cheaper price
International Balance (X - M) 3. Link between gold and money supply Summary • UK buys US shirts - pay with gold • US shirt sellers take gold to FED and ask for $s they can use • US Fed prints new money ($s) equal to increase in gold and supplies it to US shirt sellers
4. Link between money supply and prices Quantity Theory of Money Money is medium of exchange: because there is no reason to hold money since it earns nothing, if the Fed increases the money supply people will use it to buy things, which will result in more spending – either higher prices or more “stuff.” International Balance (X - M) Classical economists assume:More money = higher prices
m + v = p + y where m = % D in money supply v = % D velocity p = % D price level (inflation rate) y = % D real output Quantity Theory of Money Faster money growth (m) = faster inflation (p)
International Balance (X - M) 4. Link between money supply and prices summary • US uses new $s to buy things • When they buy new things there is shortage • In response to shortage sellers raise prices
International Balance (X - M) 5. Link between prices and trade • US balance of trade surplus (X-M>0) means gold flows into US. • Inflow of gold means more money printed in US • More money in US means higher prices in US making US goods more expensive • US buyers buy from UK (imports (M) increase) • UK buyers stop buying from US (exports (X) decrease) • US trade surplus (X-M) disappears as US exports fall and imports rise
Gold Standard when US has BOT Surplus BOT (X-M >0) surplus Gold supply money supply Price level X and M BOT surplus
Macro policy implications of Classical model Government cuts taxes (T) or raises spending (G) Increased G raises budget deficit (G-T increases) Bigger budget deficit = increased borrowing Increased borrowing = increased demand for funds (I curve shifts out) Increased demand raises interest rate Higher interest rate lowers private spending (C and I) Conclusion: higher borrowing by the government reduces private spending - no net increase in demand or income Fiscal policy (crowding out)
Macro policy implications of Classical model Monetary policy(BIG story was Germany hyperinflation) • To stimulate economy Fed prints more money • Increased money increases spending • Increased spending raises prices since already producing at capacity (no unemployment since wages flexible) Conclusion: Printing of money creates higher prices and not higher income
AS-AD model AD = negative curve • AS – as price level rises no more employment so no more output = vertical curve Price level P* Q* output
Summary of 1920s Classical Model • Economic Theorist (Adam Smith) • Macro policy implication (Crowding Out) • Monetary policy – prices only • Fiscal policy – interest rates only • AS-AD implication • Vertical AS curve • Implications • AD policies worthless • GDP depends upon AS • Supply-side Economic Policies • Fiscal - Tax cuts for wealthy, balanced budgets • Monetary - gold standard P Q
The CRASH October 29, 1929 “Stock Prices Slump $14,000,000,000 in Nation-Wide Stampede to Unload; Bankers to Support Market Today” THE NEW YORK TIMES