Download

1 / 18
190 likes | 244 Views
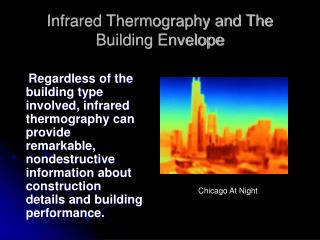
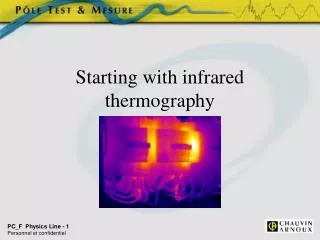
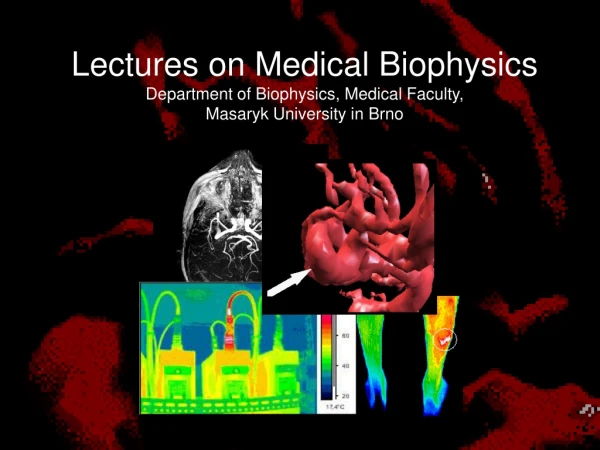
Thermography. Adam Adgar School of Computing and Technology. Thermal (infrared) energy is light that is not visible because its wavelength is too long to be detected by the human eye Part of the electromagnetic spectrum - we perceive as heat.

E N D
Thermography Adam Adgar School of Computing and Technology
Thermal (infrared) energy is light that is not visible because its wavelength is too long to be detected by the human eye Part of the electromagnetic spectrum - we perceive as heat. Objects with a temperature above absolute zero emit IR. (Even very cold objects, like ice cubes, emit infrared) The higher an object’s temperature, the greater the IR radiation emitted. Background
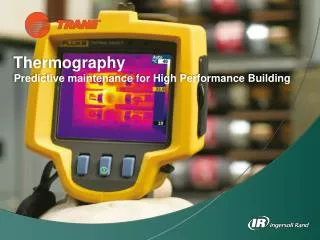
Background • IR thermography cameras produce images of this invisible radiation and provide precise, non-contact temperature measurement capabilities. • Many failures are preceded by rising temperature, making infrared cameras extremely cost-effective, valuable diagnostic tools in many diverse applications. • Components in various states of failure will emit more heat as a direct result of more energy dissipated into the component. • This extra energy is caused by increased friction in mechanical devices, and higher resistance in electrical devices. • New applications for infrared cameras continually emerge.
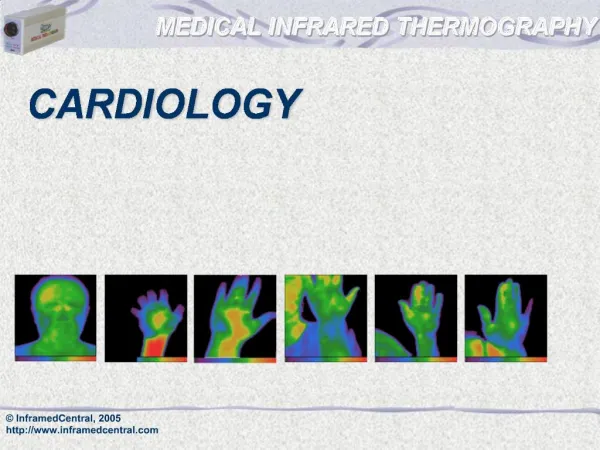
Why use infrared thermography? • Just as doctors use temperature in disease diagnosis, infrared thermography allows us to diagnose and pinpoint problems based on the temperature differential of areas. • Temperature provides an excellent identification of the condition of equipment. • It is the ability of the thermal camera to "see" these early stages of increasing temperature that makes thermography such a valuable technology.
Uses • Electrical switches • High voltage lines • Motor controls • Electrical substations • Transformers • Roofs • Boilers • Steam systems
Temperature Limits • Motor Type Temperature Limits • IEEE 117-2000 standards • Insulation system • Class A 105 °C • Class B 130 °C • Class F 155 °C • Class H 180 °C • Class N 200 °C
Loose electrical connections Poor electrical contact connections Insulation leaks Steam trap leaks Refractory deterioration Faulty components Corrosion Load imbalances Misaligned equipment Failures Detected
Infrared scanner Accuracy Sensitivity Temperature range Resolution Portability Bells and whistles Trained staff Management support What’s Needed
Typical Results • Report • thermographic images • digital images • temperature information • inventory of all anomalies • documentation of past problems • Assists in determining what needs corrective action and what is operating normally.
Limitations • Moderately expensive equipment • Cameras are easily damaged • Cannot read through glass or metal covers • Data affected by reflective nature of surface • Images can be hard to interpret accurately even with experience • Accurate temperature measurements are very hard to make because of emissivities • Typical accuracy ±2% (not as accurate as contact) • Training and staying proficient in IR scanning is time consuming
Advantages and Pay Backs • Non contact, non intrusive, non-destructive. • Moderate amount of training needed. • Compared to vibration or oil analysis • Service companies readily available. • 12 month or less cost recovery. • Output is a visual picture – • useful for large or distant objects • Identifies deteriorating components prior to failure • Measurement in areas inaccessible or hazardous for other methods
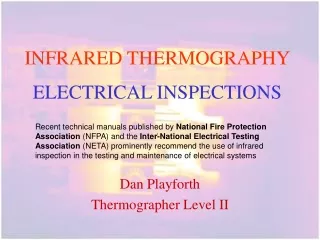
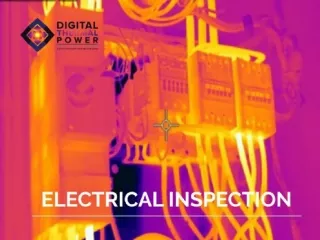
Electrical Inspections The anomaly, or absence of temperature, indicates a problem with low oil levels in the second fin.
Electrical Inspections Poor Primary Breaker Lug to Base Tab Connector or Internal Breaker Heat Source
Mechanical Inspections Infrared Image: Bearing Over Lubrication Infrared Image: Motor Monitoring
Mechanical Inspections Infrared Image: Bearing Load Strain/Wear Reference Image: Adjacent Pump
http://www.tevaltd.co.uk/thermalimaging.html More Examples This is a 200-amp main isolator in a machine panel. The faulty connection on the blue phase is clearly visible on the thermogram. The component temperature rise was only 12°C, but the component was crucial to operation and could stop production. This is a classic fuse holder problem. The thermogram shows heating upon the line-side of the fuse. Overtime the tension on the fuse clip deteriorates and becomes loose This image highlights the importance of clean equipment. The temperature of this motor was recorded at 110°C. The cause of the high temperature was pinpointed to a blocked cooling fan
References • Good examples of IR applications in many different industry sectors • http://www.flirthermography.co.uk/success/ • Read article • Daryl AndroliUsing Infrared and Ultrasonic Technology in a Predictive Maintenance Program