Download
1 / 15
150 likes | 254 Views
Lake Victoria Region: Past, Present and Future. Bukola Johnson LUMA-GIS, Sweden. Outline. Objectives Background Datasets Methodology Results Conclusion. Objectives.

E N D
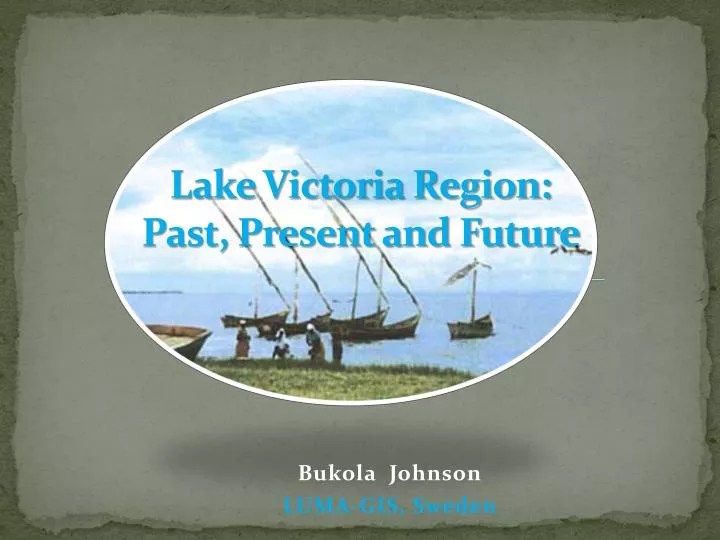
Lake Victoria Region: Past, Present and Future Bukola Johnson LUMA-GIS, Sweden
Outline • Objectives • Background • Datasets • Methodology • Results • Conclusion
Objectives Effective planning and management of finite natural resources for sustainable development in Lake Victoria Region
Background • Lake Victoria: World’s 2nd largest fresh water body • Surface boundary: Tanzania (49%), Uganda (45%) and Kenya(6%) • Economic contribution worth USD 3-4 billion annually • Sustenance for 25 million people (1/3 of the region population) • Economic activities: • Agriculture (Tea and Coffee plantation) & Fishing, • Source of water for industry & Transportation, • Recreation &Tourists attraction
Datasets Adm. Boundaries: Shape files for Kenya, Tanzania & Uganda from FAO Africover Shape file for Lake Victoria region (3 countries) from UNEP Climate Precipitation data for Africa in text (ASCII) format Peer- reviewed journal (New et al, 2002) DEM Two tiles from GTOPO30 E020N40.DEM covering Kenya and Uganda E020S10.DEM covering SE of Tanzania Land cover/ Land use IGBP raster in .bsq format for Africa . Population Raster files (.TIF format) for Africa population(1990 and 2000) from UNEP Protected Areas Personal Geodatabase (.mdb) for Africa from UNEP & World Conservation Union
Methodology • Conceptual planning and modeling. • Data previewed in Arc Catalog • Convert data to ESRI GRID format • Define data projection • Re-project data to WGS84 and Lambert Azimuthal Equal Area projection • The Study Area clipped from the Africa dataset. • Loading project data in Personal Geodatabase • Data Analysis
Results Table 1: Population Growth in Lake Victoria Region
Results Table 2: Land Cover Statistics for Kenya, Tanzania and Uganda
Results Table 3: Additional Cropland for Population in Year 2030
Crop needs sufficient and effective rain to grow and produce yields. • Croplands were located in the region with middle range precipitation. • Croplands were found around Lake Victoria.
The croplands situated where the elevation relatively low. • In high elevation, rain water essential for productivity runs off.
Results • Finite natural resources with competing demands. • Sufficient rainfall in the region with Lake Victoria as a reservoir. • Biophysical constraint such as topography that affect land use. • Elevation influences geographical distribution of croplands. • The mean annual population growth rate is about 3% for the region. • Attendant decline in cropland per capita with population growth.
Conclusions • To ensure food security and social development: • Implement landuse regulation • Convert parts of forest land to croplands • Exploit species and hybrid plants with high yield and short maturity time • Promote Family Planning to control population explosion.