Download
1 / 13
130 likes | 372 Views
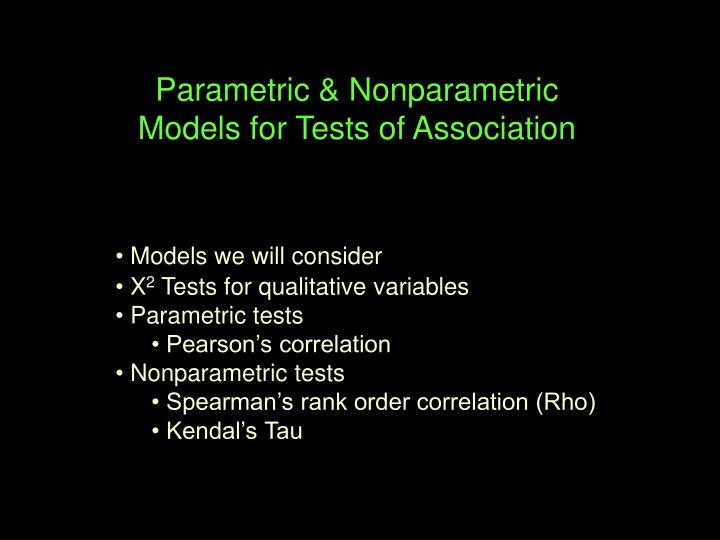
Parametric & Nonparametric Models for Tests of Association. Models we will consider X 2 Tests for qualitative variables Parametric tests Pearson’s correlation Nonparametric tests Spearman’s rank order correlation (Rho) Kendal’s Tau. Statistics We Will Consider

E N D
Parametric & Nonparametric Models for Tests of Association • Models we will consider • X2 Tests for qualitative variables • Parametric tests • Pearson’s correlation • Nonparametric tests • Spearman’s rank order correlation (Rho) • Kendal’s Tau
Statistics We Will Consider ParametricNonparametric DVCategoricalInterval/NDOrdinal/~ND univariate statsmode, #cats mean, std median, IQR univariate testsgof X21-grp t-test 1-grp Mdn test association X2 Pearson’s r Spearman’s r 2 bgX2 t- / F-test M-W K-W Mdn k bgX2 F-test K-W Mdn 2wgMcNem Crn’s t- / F-test Wil’s Fried’s kwgCrn’s F-test Fried’s M-W -- Mann-Whitney U-TestWil’s -- Wilcoxin’s Test Fried’s -- Friedman’s F-test K-W -- Kruskal-Wallis Test Mdn -- Median TestMcNem -- McNemar’s X2 Crn’s – Cochran’s Test
Statistical Tests of Associationw/ qualitative variables • Pearson’s X² • Can be 2x2, 2xk or kxk – depending upon the number of categories of each qualitative variable • H0: There is no pattern of relationship between the two qualitative variables. • degrees of freedom df = (#colums - 1) * (#rows - 1) • Range of values 0 to • Reject Ho: If ²obtained > ²critical (of – ef)2 X2 = ef Σ
Col 1 Col 2 * 22 54 76 Row 1 Row 2 RowColumn totaltotal = N ef 46 32 78 The expected frequency for each cell is computed assuming that the H0: is true – that there is no relationship between the row and column variables. 6886 154 Col 1 Col 2 If so, the frequency of each cell can be computed from the frequency of the associated rows & columns. (76*68)/154 (76*86)/154 76 Row 1 Row 2 (78*68)/154 (78*86)/154 78 6886 154
(of – ef)2 X2 = ef Σ df = (2-1) * (2-1) = 1 X21, .05 = 3.84 X2 1, .01 = 6.63 p = .0002 using online p-value calculator So, we would reject H0: and conclude that there is a pattern of relationship between the variables.
Parametric tests of AssociationusingND/Int variables • Pearson’s correlation • H0: No linear relationship between the variables, in the population represented by the sample. • degrees of freedom df = N - 2 • range of values - 1.00 to 1.00 • reject Ho: If | robtained | > rcritical • Pearson’s correlation is an index of the direction and extent of the linear relationship between the variables. • It is important to separate the statements… • there is no linear relationship between the variables • there is no relationship between the variables • correlation only addresses the former!
Correlation can not differentiate between the two bivariate distributions shown below – both have no linear relationship Σ ZX*ZY r = N • One of many formulas for r is shown on the right. • each person’s “X” & “Y” scores are converted to Z-scores (M=0 & Std=1). • r is calculated as the average Z-score cross product. +r results when most of the cross products are positive (both Zs + or both Zs -) -r results when most of the cross products are negative (one Z + & other Z-)
Nonparametric tests of Associationusing~ND/~Int variables • Spearman’s Correlation • H0: No rank order relationship between the variables, in the population represented by the sample. • degrees of freedom df = N - 2 • range of values - 1.00 to 1.00 • reject Ho: If | robtained | > rcritical • Computing Spearman’s r • One way to compute Spearman’s correlation is to convert X & Z values to ranks, and then correlate the ranks using Pearson’s correlation formula, applying it to the ranked data. This demonstrates… • rank data are “better behaved” (i.e., more interval & more ND) than value data • Spearman’s looks at whether or not there is a linear relationship between the ranks of the two variables
The most common formula for Spearman’s Rho is shown on the right. To apply the formula, first convert values to ranks. 6Σd2 r = 1 - n(n2 -1) rank rank # practices # correct 4 5 1 4 2 1 5 3 3 2 # practices # correct S1 6 21 S2 2 18 S3 4 7 S4 9 15 S5 5 10 d d2 -1 1 -3 9 1 1 2 4 1 1 Σd2 = 16 6 * 16 r = 1 – = 1 - .80 = .20 5 * 24 For small samples (n < 20) r is compared to r-critical from tables. For larger samples, r is transformed into t for NHSTesting. Remember to express results in terms of the direction and extent of rank order relationship !
So, how does this strange-looking formula work? Especially the “6” ??? 6Σd2 r = 1 - n(n2 -1) Remember that we’re working with “rank order agreement” across variable – a much simpler thing than “linear relationship” because there are a finite number of rank order pairings possible! • If there is complete rank order agreement between the variables … • then, d = 0 for each case & Σd2 = 0 • so, r = 1-0 • r = 1 indicating a perfect rank-order correlation • If the rank order of the two variables is exactly reversed… • Σd2 can be shown to be n(n2-1)/3 • the equation numerator becomes 6 * n(n2 – 1)/3 = 2 * n(n2 – 1) • so, r = 1 – 2 • r = -1 indicating a perfect reverse rank order correlation • If there is no rank order agreement of the two variables … • Σd2 can be shown to be n(n2-1)/6 • the equation numerator becomes 6 * n(n2 – 1)/6 = n(n2 – 1) • so, r = 1 – 1 • r = 0 indicating no rank order correlation
Nonparametric tests of Associationusing~ND/~Int variables • Kendall’s Tau • H0: No rank order concordance between the variables, in the population represented by the sample. • degrees of freedom df = N - 2 • range of values - 1.00 to 1.00 • reject Ho: If | robtained | > rcritical • All three correlations have the same mathematical range (-1, 1). • But each has an importantly different interpretation. • Pearson’s correlation • direction and extent of the linear relationship between the variables • Spearman’s correlation • direction and extent of the rank order relationship between the variables • Kendall’s tau • direction and proportion of concordant & discordant pairs
The most common formula for Kendall’s Tau is shown on the right.** 2(C-D) tau = n(n -1) rank rank # practices # correct X Y 4 5 1 4 2 1 5 3 3 2 # practices # correct S1 6 21 S2 2 18 S3 4 7 S4 9 15 S5 5 10 To apply the formula, first convert values to ranks. rank rank # practices # correct X Y 1 4 2 1 3 2 4 5 5 3 # practices # correct S2 2 18 S3 4 7 S5 5 10 S1 6 21 S4 9 15 Then, reorder the cases so they are in rank order for X. **There are other forumlas for tau that are used when there are tied ranks.
rank rank # practices # correct X Y 1 4 2 1 3 2 4 5 5 3 # practices ` # correct X Y S2 2 18 S3 4 7 S5 5 10 S1 6 21 S4 9 15 CD 1 3 3 0 2 0 0 1 sum 6 4 For each case… C = the number of cases listed below it that have a larger Y rank (e.g., for S2, C=1 there is one case below it with a higher rank - S1 ) D = the number of cases listed below it that have a smaller Y rank (e.g., for S2, D=3 there are 3 cases below it with a lower rank - S3 S5 S4) 2(C-D) tau = n(n -1) 2(6 - 4) 4 = = = .20 5(5 - 1) 20 For small samples (n < 20) tau is compared to tau-critical from tables. For larger samples, tau is transformed into Z for NHSTesting.