Download
1 / 6
60 likes | 84 Views
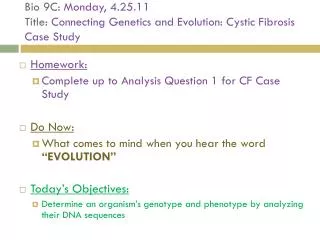
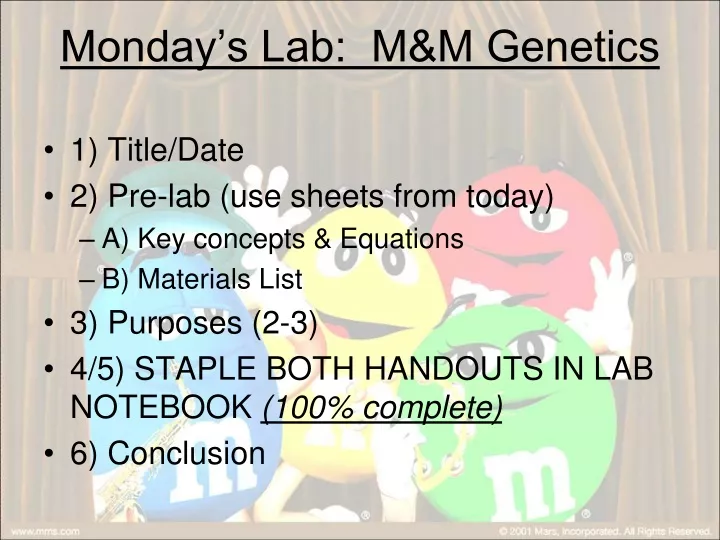
Monday’s Lab: M&M Genetics. 1) Title/Date 2) Pre-lab (use sheets from today) A) Key concepts & Equations B) Materials List 3) Purposes (2-3) 4/5) STAPLE BOTH HANDOUTS IN LAB NOTEBOOK (100% complete) 6) Conclusion. Phenotype. Genotype. # Observed. Expected. (o – e). Green. GG or Gg.

E N D
Monday’s Lab: M&M Genetics • 1) Title/Date • 2) Pre-lab (use sheets from today) • A) Key concepts & Equations • B) Materials List • 3) Purposes (2-3) • 4/5) STAPLE BOTH HANDOUTS IN LAB NOTEBOOK (100% complete) • 6) Conclusion
Phenotype Genotype # Observed Expected (o – e) Green GG or Gg 72 Albino gg 12 Total = 84 • Chi-square (Χ2) Statistical Analysis • Used to determine if observed data are close enough to expected data • Example • P: Gg x Gg expect 3:1 G = green • g = albino • Table 7.3 63 21 84 9 -9 There is a small difference between observed & expected. Is it close enough to say this is a 3:1 or is there too much variance???? We use the Chi-square test to determine this.
(o – e)2 e Χ2 = Σ • Chi-square (Χ2) • Used to determine if the observed data fall within acceptable limits & tests the • validity of a null hypothesis • Null hypothesis – states there is NO statistically significant difference between • the observed & expected values o = observed e = expected Σ = sum of values
(o – e)2 e Χ2 = Σ = Table 7.4
(o – e)2 e Χ2 = Σ Table 7.4 = 5.15 We now compare our calculated Χ2 value with the Critical Values Table Remember: null hypothesis says there is NO significant difference between the observed & expected data.
Critical Values of the Chi-Square Distribution • df = categories – 1 categories = phenotypes • = 2 – 1 • df = 1 2. p value p = 0.05 for science 3. Compare calculated Χ2 to table 5.15 > 3.84 REJECT null hypothesis…..observed data are not the same as expected Observed data are not a 3:1 ratio