Download
1 / 11
120 likes | 403 Views
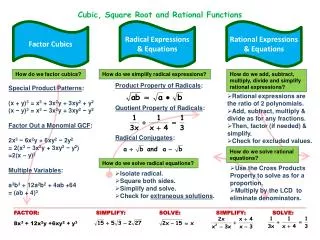
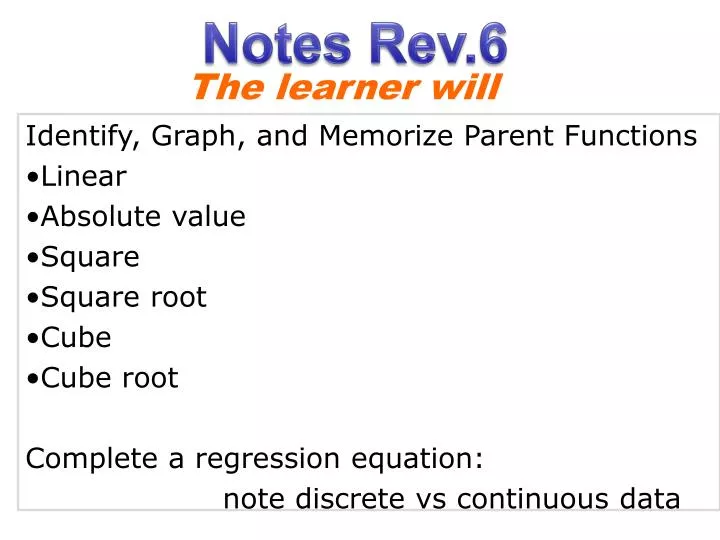
Notes Rev.6. The learner will. Identify, Graph, and Memorize Parent Functions Linear Absolute value Square Square root Cube Cube root Complete a regression equation: note discrete vs continuous data. Notes Rev.6 Parent Functions. Linear. Domain: Range:.

E N D
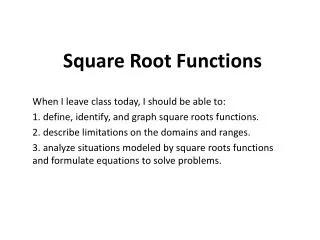
Notes Rev.6 The learner will Identify, Graph, and Memorize Parent Functions • Linear • Absolute value • Square • Square root • Cube • Cube root Complete a regression equation: note discrete vs continuous data
Notes Rev.6 Parent Functions Linear Domain: Range: X is all reals Y is all reals -2 -1 0 1 2
Notes Rev.6 Parent Functions Absolute Value Domain: Range: X is all reals y≥0 2 1 0 1 2
Notes Rev.6 Parent Functions Quadratic (squared) Domain: Range: X is all reals y≥0 4 1 0 1 4
Notes Rev.6 Parent Functions Square Root Domain: Range: X ≥ 0 Y ≥ 0 0 1 2 3 4
Notes Rev.6 Parent Functions Cubic Domain: Range: X is all reals Y is all reals -8 -1 0 1 8
Notes Rev.6 Parent Functions Cube Root Domain: Range: X is all reals Y is all reals -2 -1 0 1 2
Graph over a specific domain Graph y=x given the domain
Lets look at scatter plots and find a line of best fit How? Regression Equations On the TI83
Scatter Plot/Regression Equation 2nd Statplot(key above “y=“) Enter Enter (This turns statplot on) Stat (key under delete key) Edit (on screen) : (Enter x data in L1 and y data in L2)2nd Quit find a regression eq Stat Calc (on screen) 4(lin reg) Enter send regression equation to y= : Y= vars #5(statistics) EQ enter
Given the data below, create a regression eq (best fit line) to predict the height of a 40 year old person. Is this prediction reasonable? Regression Equation: After a certain age, you stop growing. The actual data would not be linear after the growing years. This data does not accurately represent the height of a 40 year old person. Predict the height of a 20 year old. 189.5 cm Write your equation by rounding to the 3rd decimal place but don’t use the rounded equation to predict because the answer is less accurate that way!