Download
1 / 30
300 likes | 307 Views
Index Based Insurance – an innovative approach towards agricultural risk financing mechanism . Inderjit Claire October 2007. Background – a general perspective. High exposure of low income countries to weather risks (drought, floods…), pests and diseases

E N D
Index Based Insurance – an innovative approachtowards agricultural risk financing mechanism Inderjit Claire October 2007
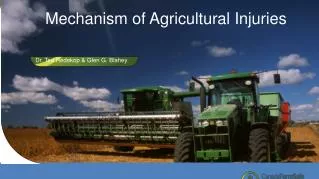
Background – a general perspective • High exposure of low income countries to weather risks (drought, floods…), pests and diseases • Lack of insurance and other risk management tools • Need of innovative approaches to deal with the nature of agricultural risks Rainfall and economic performance in Andhra Pradesh
Background – Traditional Vs Index Based Insurance • Multi-peril Crop Insurance • High Administrative Costs • Moral Hazard • Adverse Selection • Index-Based Weather Insurance • Rainfall is a proxy for damage • Objective triggers and structured rules for payouts • Improved correlation between need and provision More on Index Based. . . • Financial protection against adverse weather conditions • Contracts can be structured as insurance or derivatives • Based on the performance of a specified weather index during the risk period • Payouts are made if the index crosses a specified trigger level at the end of the contract period • Protect against yield volatility
Goals • The goal is to meet the demands of various stakeholders • Farmers • Insurers • Delivery channels • Marketing agencies/organizations etc • Steps involved in the design and validation of the weather insurance pilots • Demand assessment • Ensuring initiatives were in response to perceived and expressed needs of farmers and their interest groups • Identification of key insured parties : compulsory or voluntary • Determination of key perils • The most important factor in insurance design • Decision on crops to be covered • Loss assessment procedures • Rating • Identify possible complementary role of Government
Stage 1 - Desk Research Literature review -draw lessons from past experiences Data availability Crop yield data CCE data/insurance units level Mandal/district level • weather data • Daily • weekly Selection of area Selection of crops - Identify preliminary risks Desk Research • Evaluation of weather and crop yield data • Availability of weather data • Temporal • Spatial, • Limitations • Availability of crop yield data • Temporal • Spatial • Limitations • Collection of relevant research • IMD Crop calendar • Refer ICAR publications on Field and Plantation crops • Meeting with agrometeorologists, agronomists • To identify essential crop pheonphase risks • Critical crop growth stages and their dependencies to rainfall affecting yield • Review of insurance products being offered, if any! • Local climatology
Data Analysis Stage 2 - Data analysis • Sanity checks • Data consistency • Data quality • Data limitation • 1. Weather Data cleaning and enhancement • - Replacement of missing and erroneous values • through spatial and temporal interpolation/correlations • 2. Detect data discontinuities • Through one or multiple stations values • 4. Evaluation of crop yield data • - For mandal/ district level validation as proxy of weather • 3. Weather simulation (WXGEN) • To generate 100 yrs of data using Markov chain model
Field Research Stage 3 - Field Research • Demand assessment • Examine the risk structure of specific key crops • 2. Determination of key perils • a key factor in insurance design • 3. Decision on crops to be covered • another key factor • 4. Identify crop growing season • Key crop growth stages and duration • 5. Significance of specific weather parameters • Analysis on index able weather perils • 6. Critical/ strike for weather parameters • Definition of strike and exits for the payouts • Definition of daily rainfall floor • Periodic rainfall caps • Daily level excess rainfall limits etc
Contract Design Stage 4 – Preliminary contract design • Identification of insurable risks (Key Perils) • Production risks due to adverse weather conditions • Drought/ Deficient rainfall • Sowing cover e.g. failed sowing/ germination failure • Phenophase – wise cover e.g. Vegetative Growth, Flowering, Grain Filling etc. • Excess rainfall • Frost (temperature based index) • High Winds • Satellite NDVI based cover
Weather Contract Design • Overarching Objective • To design contracts that cover • both magnitude and frequency of deviations of key weather parameters from requisite levels. • The challenge was to do it in an integrated manner (under a single cover) while ensuring robustness of the contracts
Weather Contract Design (Choice of Key Product Components) • Choice of caps and floors • Choice of triggers/ limits • Choice of indemnity payment levels • Choice of period & stages of cover • Interchangeability between indices and actual weather parameter values • Choice of sum assured under various covers • Overall flexibility in setting product parameters
50 days 15-55 days 40 days Vegetative Growth & Flowering Boll Formation & Boll Development Sowing & Germination Inadequate Rainfall for Sowing Covers for Crop Stages after Germination Deficient Rainfall for Vegetative Growth& Flowering Deficient Rainfall for Boll Formation & Boll Development Perils Coverage of Weather Risks – Cotton, Mahabubnagar District Harvest Ploughing Stages
Risk assessment • Risk profile of the areas – importance of weather risk in this profile • Availability of yield data and agronomic information • Issues related to basis risk – topographic make-up, presence of microclimates • Weather data and infrastructure – presence of weather stations, satellite information, historical data • Time period – key seasonal milestones
Data Availability • Rainfall data for Anantapur and Mahabubnagar Blocks • Field visit - 4 mandals in Anantapur and 6 Blocks in Mahabubnagar • IMD weather data • Anantapur • Rainfall data available for 18-25 years (upto 2003) • Mahabubnagar • Rainfall data available for 16-18 years (upto 2003) • Crop Yield Data • Mandal level • District level • Primary/Secondary information collected • Field survey • Agro meteorological/ agronomic information • Literature review – e.g., ICAR publications, iKisan etc
Data Availability • Crop Calendar
Hazard Module Simulated Weather Generator Vulnerability Module Crop Yield Model Planting Area Model Probabilistic Drought Assessment – a framework • Customized from rapid onset disaster modeling framework • Probabilistic drought risk assessment model • Hazard module • Vulnerability module • Economic module Historical weather Stochastic normal & drought events Crops Soil Mgmt. Production losses
Hazard Module – Historical Weather • Mandal level Rainfall data used • Is 1988 – 2003 data enough (18-25 years) for non-parametric analysis? • Simulations produce more tail (extreme) events
Historical Weather – analyzing hazard • Data cleansing - Sanity checks • Spatial and temporal consistency • No de-trending • Rainfall is lowest in Anantapur District • Coefficient of Variation is highest • Anantapur • Mahabubnagar • Rainfall risk is very high in these two districts
Hazard module – validation of stochastic weather events • The exceedance probability curves for both annual rainfall in historical and simulated data show the same trend (zero exceedance probability is equal to 800 in both the cases and rainfall with exceedance probability as 1 is just below 200). • Therefore the corresponding yield and rainfall curves from historical and simulated data are in line with each other.
Vulnerability Model - Crop model • EPIC simulated yield • Generated at Mandal level • Mandal level rainfall data used • Management inputs taken from ANGRAU • Field based inputs used • Reported yield • Available at both Mandal and district level • Results validated • drought years Agro-met model
Vulnerability Mapping • Crop Yield Simulations - For each model • Using historical data and then • Simulated weather events • Vulnerability mapping @ Mandal level • Across six districts of AP • Covers both high and low vulnerable areas State of Andhra Pradesh
Vulnerability Model - validations The yield deviations of the simulated data is in the same range as the historical yield data
Losses • Exceedence Probability loss • Average Annual loss • Probable Maximum loss
Key Issues • Technical Issues • Basis risk • Introduction of Mandal-level weather stations can help to mitigate intra-district heterogeneities • Farm level issue may prolong until density of weather stations improves substantially • Daily level measurement of rainfall and its dissemination to end-clients • Regular and timely communication of weather data to facilitate better tracking of indemnities • Asymmetries in geographical demarcation of insurance units needs consideration • Interpolation of weather data between existing and proposed weather stations to offset asymmetries due to administrative demarcation • Traditional MPCI will not get covered • Fire, hail storm etc • Pricing at every Mandal will NOT carry the same degree of confidence • Shall depend on quality and availability of weather data applied • Will require supporting field data and local knowledge • Allow premium adjustment based on experiences and underlying risk • Administrative Issues • Geographical and administrative equivalent of Mandal does not exist in any other pilot state except A.P. • Banks covered during the field research have expressed difficulties in two insurance schemes
Satellite based insurance contract design Early Rice Late Rice
Basis for approaching the new Classification – Spectral signatures FCC Overview Classified 18 August 2006 14 May 2006 12 June 2006 15 July 2006
Ex: Wheat NDVI Analysis • Crop mapping • Supervised Classification technique • Area Estimation • Accuracy Assessment Graph showing reported vs mapped acreage figures for wheat crop in the district. The difference is of 15.21 %. • NDVI analysis • NDVI value computation using available values
Ex: Indemnity Payout Structure for NDVI Based Cover • NDVI based insurance product for wheat in Farrukhabad tehsil of Farrukhabad district Payout structure is based on the slabs for a standard sum assured of Rs 100 Payout Structure • Crops having satellite derived rescaled mean NDVI values greater than 181 will receive no compensation • Between 181 and 180.5, farmers will receive 2 rupees for 0.5 value of deficit • Between 180.5 and 179, farmers will receive 4 rupees for 0.5 value of deficit • Between 179 and 175, farmers will receive 5 rupees per value of deficit • Between 175 and 173, farmers will receive 10 rupees per value of deficit
Conclusions • At the household level: • Gives farmers greater flexibility in investment decisions • Banks have greater interest in lending • Farmers see potential in investing in their farms • For governments: • Provides government contingent financing • Allows the cost of drought risk to be smoothed over time • Provides some predictability to drought financing and buys time for other emergency responses to take affect • Provides government a level of autonomy