Download
1 / 30
300 likes | 562 Views
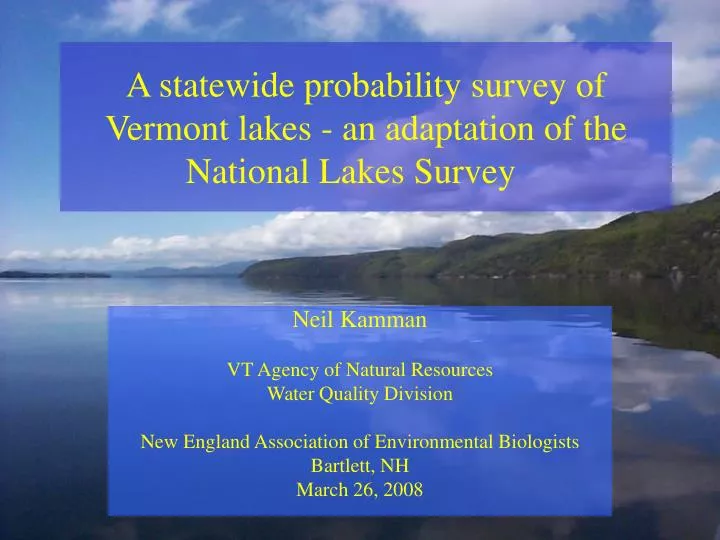
A statewide probability survey of Vermont lakes - an adaptation of the National Lakes Survey Neil Kamman VT Agency of Natural Resources Water Quality Division New England Association of Environmental Biologists Bartlett, NH March 26, 2008 Some acknowledgements Funding USEPA C.W.A. 106

E N D
A statewide probability survey of Vermont lakes - an adaptation of the National Lakes Survey Neil Kamman VT Agency of Natural Resources Water Quality Division New England Association of Environmental Biologists Bartlett, NH March 26, 2008
Some acknowledgements • Funding • USEPA C.W.A. 106 • VTANR • Individuals • Hilary Snook EPA R1 • McKalyn Garrity, Eric Howe, Sarah Wheeler
Today’s discussion • Purpose and design • Indicators and field approach • Progress with data analysis • The sample draw as a palate for analyzing existing data • The littoral habitat assessment – analysis of new data • Outreach
Purpose • National Lakes Survey • Component of USEPA’s probability survey initiative • Lakes are one of several resources assessed over 5-year repeating blocks • New England Lakes and Ponds Project • a regional do-over of EMAP NE Lakes leveraging the national draw • VT Lakes Survey • provides a probability survey of our lakes that also contributes to NELP and NLA. • VT’s interest is to capture a second probability survey of our lakes*, and to evaluate NLA and NELP techniques for adoption as standard VT protocols *) The first probability survey was the ’98-’99 REMAP Mercury Project
Design • 2007: Sampled 33 lakes • 10 NLA core lakes • 20 additional state lakes from the overdraw. • Gives its own probability survey w/ ~85% CL. • 3 reference lakes (2 from overdraw, one selected). • 2008: Sample 25 lakes • Begin at # 25 on the sample roster • Completes survey to a 50-lake probability survey w/ 95% CL. • All VT lakes contributing to New England Lakes and Ponds Regional Study. • Lake selection carried out by EPA Corvallis on the NHD lakes sample frame as a stratified random draw of 10+ acre waters.
Variance components capture by the VT design • Within lakes • QA on 6 lakes, including replication, spikes, and blanks. • Within years • One lake resampled in 2007, another in 2008. • Among years • Five lakes sampled in 2007 are resampled in 2008.
2007 – 2008, 50 lakes, ~95% CL, +3 reference lakes 2007, 33 LAKES, ~85% CL 2008, +25 LAKES Replication lake Resample lakes Reference lakes
Indicators • 10 NLA Core lakes (+ reference lakes): • All NLA indicators • Laboratory splits with DEC lab for all WQ parameters and sediment Hg. • 40 VT State lakes • Water chemistry - Multiprobe • Macroinvertebrates (NLA) - Whole phytoplankton • Littoral habitat - VT littoral habitat (subset) • Sediment mercury
Complete* Database construction Water chemistry (VT) Multiprobe Littoral habitat *) for 2007 lakes In process Water chemistry (national lab) Whole phytoplankton VT littoral habitat (subset) Sediment mercury Macroinvertebrates (NLA+VT) Progress with data analysis
The sample draw as a palate for analyzing existing data • VT lucked out on the random draw… • 59 “lakes” provided in total • 4 rejected as land areas that were misattributed in NHD • Permission denied on one lake • Of the remaining lakes in the draw, VT has existing data on every one. • In this section, three thought-experiments: • Statewide assessment of trophic condition of VT lakes • Statewide assessment of lake trophic trends • Use the survey to support nutrient criteria inquiry?
Statewide assessment of trophic condition and trends • Most survey lakes have data from 2 or more DEC monitoring programs • Total count of individual datapoints in existing databases for the survey lakes > 63,000 • Plenty of nutrient data
Statewide assessment of trophic condition and trends • Data used: • Spring Phos. Program: included data for lakes w/4+ years data • Lay Monitoring Program: included data for lakes w/ at least one summer • Acid lakes monitoring program • Kendall-tau statistic used to detect trends, adjusted for experiment-wise error VT Draft 2008 305(b) Integrated Water Quality Assessment Report
Figure C.2. Cumulative frequency distributions of total phosphorus (spring and summer), and summer chlorophyll-a and Secchi transparency, based on the National Lakes Survey draw for Vermont. Drop-lines show the percent of lakes exhibiting oligotrophic (blue), mesotrophic (yellow), or eutrophic (green) conditions.
Results as compared to the targeted assessment • Probability predictions accurately predict total assessment from targeted lakes • A surprising proportion of lakes show detectable trends relative to overall dataset Left bar = targeted lakes; right bar = probability lakes
Nutrient criteria analyses • Can the draw be used to assist in the derivation of nutrient criteria? • Supplement existing analyses of targeted waters, and satisfying the “random” assumption implicit in predicting nutrient responses from stressors using statistics. • Theoretical example: predicting chlorophyll-a impacts from TP • For this example, conditional probability analysis was used to evaluate the likelihood of a given chlorophyll-a [conc.] across a range of phosphorus values.
17 ppb 21 ppb Conditional probability analysis • Assume that a mean summer chlorophyll-a above 10 ppb is “undesirable” • What is the conditional probability of this occurrence given spring total phosphorus? • Can this inform selection of a potential criterion value?
Littoral habitat assessment • Riparian and shoreline zone • canopy, cover, slope, and disturbance estimated • Littoral zone • substrate, macrophyte cover, woody debris estimated • 57 measurements x 10 (or more) locations x 50 lakes (before QC) • >28,500 individual data points • Thank goodness for Hilary’s electronic data capture • What a fishing expedition! Can we use lessons from work of Merrell et al. as a guide? • In the following slides, results are based on the lakes sampled in 2007.
Development affects plant growth counter-intuitively • Merrell et al.* show that in developed sites, plant cover is more dense. • They attribute this to removal of tree canopy, permitting additional light penetration to the littoral zone and accentuating nutrient and sediment loss, particularly at shallow sites. Capen et al. 2008. Final Report (in prep) to the Northeastern States Research Cooperative (NSRC). Lakeshore Development Patterns in the Northern Forest of Vermont and Implications for Water Quality.
Hypothesis: canopy cover in the riparian zone influences plant growth • For survey lakes, where canopy cover is low or absent, macrophyte cover can be significantly greater. There is a breakpoint at 10% canopy.
Hypothesis: managed sites also have more macrophyte growth • For survey lakes, sites managed for public recreation display significantly more floating and total plant cover, again implicating light and nutrient effects.
Development results in loss of coarse woody debris habitat • Merrell et al. show that in developed sites, there is a significant loss of coarse woody debris, which is a critical component of aquatic habitat. There is also a significant increase in sand. • This is due to removal of debris and (in most VT lakes) importation of sand for recreational or other purposes.
Hypothesis: developed sites show less coarse woody debris habitat and more sand • In the survey lakes, the relative cover of coarse woody debris is significantly reduced, while sand is far more predominant
Littoral habitat • Considerable commonalities in findings between the designed work of Merrell et al., and the comparative observational assessment of the NLA. • More inquiry and analysis of the “Phab” dataset is needed. There are potentially important avenues here for the national analysis. • To properly explore this, we need to synthesize a “disturbance” variable from the multiple captured parameters. • Once the full dataset is available, we will comprehensively analyze this dataset.
Outreach • Publicized the survey by means of VTANR website. • Placed column in VTANR’s “Out of the Blue” newsletter announcing study, and providing updates. • Informed VT Federation of Lake Associations of the initiative. • Solicited assistance from volunteer lakes monitoring community. • Engaged citizens in sampling. While this often extended the length of the workday, the interaction provided valuable information about the study lakes, as well as educational opportunities.
In 2008 • Finish field work. • Develop analytical approach for littoral habitat • Analysis of state-lake macroinvertebrates by contract (??...in discussion). • Provide quantified probability estimates of physical, chemical, and biological conditions for VT lakes. • Look to national analyses as a potential template for reviewing these state-specific data.
Questions? Contact: Neil Kamman VTDEC-WQ 103 S. Main 10N Waterbury, VT 05671-0408 Neil.kamman@state.vt.us
Supplemental slide • What is we used only simultaneously-collected data from the summer survey to estimate Chla response by TP?