Download
1 / 37
370 likes | 694 Views
The American Paradox: “Everyone Deserves a Change and Yet You are Expected to Make it on Your Own" Poverty In America: A look at recent social statistics Amy Glasmeier Department of Geography Penn State Huddle Lunch Time Talk October 28, 2008 Americans Feel the Rich Have Too Much

E N D
The American Paradox: “Everyone Deserves a Change and Yet You are Expected to Make it on Your Own" Poverty In America: A look at recent social statistics Amy Glasmeier Department of Geography Penn State Huddle Lunch Time Talk October 28, 2008
Americans Feel the Rich Have Too Much But They Don’t Necessarily Want to Redistribute Wealth
Americans Feel Sorry for the Poor But Don’t Necessarily Want to Help Them as They see the Plight of the Poor Self Made
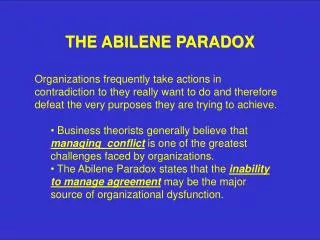
A Nation That Believes Everyone Deserves a Chance But, We Should Make it on Our Own How do We Make Sense of This?
There is a Growing Number of People Becoming Economically Insecure And they Look Like you or I As Yard Sales Boom, Sentiment First Thing to Go http://www.nytimes.com/2008/10/25/us/25garage.html?th&emc=th
Economic Insecurity Arises Due to A Sharp Change in a Person’s Circumstances—Like Unemployment of an Unexpected Rise in Costs
UNEXPECTED COST INCREASES HIT REGIONS OF HIGH POVERTY HARD: EXPENDITURES FOR GASOLINE AS A PERCENT OF INCOME
PERCENT OF PERSONS ON SOCIAL SECURITY DISABILITY AND WORKING
MY TALK TODAY • Part I: • The definition of poverty in the US • The context for poverty policy starting in the 1950s • Part II • The origins of poverty policy in the US and the recognition of geography as seen through images that accompanied the nation’s concerted attempt to address the poor in America • Part III • The current context and why now is a time for reframing with the help of geography
How We MEASURE Poverty: From thrifty food budget to poverty line Molly Orshansky, 1970s The poverty thresholds (also called “poverty lines”) are income levels that the Census Bureau compares to actual family income to determine poverty status. The current, official thresholds are referred to as the “Orshansky thresholds,” after government economist Mollie Orshansky, who combined measures of need and expenditure. This metric was chosen to avoid a debate about income redistribution; absolute poverty could be eradicated, relative poverty would always persist.
How Poverty is Measured • In 1963-1964, Molly Orshansky of the Social Security Administration developed poverty thresholds. • Orshansky based her poverty thresholds on the "thrifty food plan," which was the cheapest of four food plans developed by the Department of Agriculture. • The food plan was "designed for temporary or emergency use when funds are low," according to the USDA. Based on the 1955 Household Food Consumption Survey from the USDA (the latest available survey at the time), • Orshansky knew that families of three or more persons spent about one third of their after-tax income on food. She then multiplied the cost of the USDA economy food plan by three to arrive at the minimal yearly income a family would need. • Using 1963 as a base year, she calculated that a family of four, two adults and two children would spend $1,033 for food per year. Using her formula based on the 1955 survey, she arrived at $3,100 a year ($1,033 x3) as the poverty threshold for a family of four in 1963. • Orshansky differentiated her thresholds not only by family size, but also by farm/non-farm status, by the number of family members who were children, gender of the head of household, and by aged/non-aged status. The result was a detailed matrix of 124 poverty thresholds. Generally, the figures cited were weighted average thresholds for each family size. • Same method today, just adjusted for the changes in the value of the dollar.
OTHER INDUSTRIALIZED COUNTRIES USE 60% OF THE MEDIAN HOUSEHOLD INCOME UK and US 60% of Median Income, US Absolute Measure
USING THE FEDERAL MEASURE, THE NUMBER OF POOR HAS STAYED THE SAME EVEN AS THE POPULATION HAS INCREASED
HISTORICALLY, PUBLIC PLICY HAS BEEN EXTREMELY IMPORTANT IN REDUCING POVERTY IN THE COUNTRY LET’S STEP BACK A MINUTE AND LOOK AT HISTORY
POVERTY BEGAN TO BE RECOGNIZED AS A MULTIFACETED PROBLEM WITH NO SINGLE CAUSE From TheNew York Times In 1964: Industrial regions were thriving; The South was the region of poor people; Most poor families in the US were those whose principal wage earner worked. Those with low education levels; Race mattered, but the majority of poor people were white.
The Context of American Poverty Policy • 1950s From rural to urban; the elderly, the disabled, children, single female-headed households, people of color, poorly educated; low paid • 1960s Under valued assets and the need to invest in education and training; place matters; children, single female- headed households, people of color, poorly educated • 1970s Work no longer guaranteed; changes in labor market precipitated need to raise income; pervasiveness and spatial mobility diminishes validation of place; men of color and families • 1980s Stagnation and restructuring led to retreat and class conflict; place under attack, pathology of the poor; mobility the key • 1990s Moving from welfare to work boosted earned income while decreasing material standard of living; spatial dispersion reduces the profile of place as a relevant category
DOUGLAS’S EFFORTS PAY OFF IN AN AGENCY ARA AND THEN EDA Federal Effort To Define Locations Of Economic Insecurity
Who is Poor in 2007 • The official poverty rate in 2007was 12.5 percent, not statistically different from 2006. • In 2007, 37.3 million people were in poverty, up from 36.5 million in 2006. • Poverty rates in 2007 were statistically unchanged for non-Hispanic Whites (8.2 percent), Blacks (24.5 percent), and Asians (10.2 percent) from 2006. The poverty rate increased for Hispanics (21.5 percent in 2007, up from 20.6 percent in 2006). • The poverty rate in 2007 was lower than in 1959, the first year for which poverty estimates are available, while statistically higher than the most recent trough in 2000 (11.3 percent). • The poverty rate increased for children under 18 years old (18.0 percent in 2007, up from 17.4 percent in 2006), while it remained statistically unchanged for people 18 to 64 years old (10.9 percent) and people 65 and over (9.7 percent).
HOW FAR OFF FROM BEING OUT OF POVERTY ARE AMERICAN FAMILIES?
STRUCTURAL FACTORS COUNT SUCH AS WAGES DIFFERENCES FOR MEN AND WOMEN FOR THE SAME JOB
INCOME INEQUALITY ALSO CONTRIBUTES TO THE RISE IN ECONOMIC INSECURITY—BEHIND THE NUMBERS IS A DECLINE IN THE NUMBER OF GOOD JOBS
The Work Poor Are Growing and Are Geographically Concentrated • Compared to the beginning of this decade, more people across the country now live in areas with high rates of working poverty. As high-working-poverty areas have become more prevalent over the first half of the decade, low-income workers and families have become relatively more geographically concentrated in these communities. • These trends were particularly pronounced in older industrial metro areas throughout the Midwest and Northeast, such as Rochester, Detroit, Philadelphia, and Cleveland. While over half of the metro areas in this study saw increases in their concentrated working poverty rate, metropolitan areas in the West (e.g.,Los Angeles) and in parts of the South (e.g., Cape Coral) showed declines in the spatial concentration of working-poor families and individuals within their regions.
The Number of Working Poor Filing for the EITC is on the Rise The number of tax filers nationwide living in areas with high rates of working poverty increased by 40 percent, or 1.6 million filers, between tax years 1999 and 2005. By 2005, 12.3 percent of low-income working families lived in high-working-poverty communities— ZIP codes where more than 40 percent of taxpayers claimed the EITC—up from 10.4 percent in 1999. Among 58 large metropolitan areas, rates of concentrated working poverty (the share of EITC filers living in high-working-poverty communities) rose in 34 over the first half of the decade, while 24 showed declines. Older industrial metro areas including Detroit and Rochester exhibited the greatest increases in concentrated working poverty, while the Los Angeles and Phoenix metro areas experienced the largest declines. Major metropolitan areas in the Midwest and Northeast experienced substantial increases in concentrated working poverty over the first half of the decade, but Western metro areas saw steep declines. Metro areas in the Northeast and West had similar rates of concentrated working poverty in 1999 (13 percent), but by mid-decade, the rate had risen to 18 percent in the Northeast while it dropped to 7 percent in the West. Both central cities and suburbs saw an increase in high-working-poverty communities between tax years 1999 and 2005. The number of tax filers living in high-working-poverty areas in the central cities of major metropolitan areas across the country grew by 40 percent, while the surrounding suburbs experienced an increase of 36 percent. Still, central-city EITC recipients were five times as likely (25 percent) as suburban EITC recipients (5 percent) to live in high-working-poverty communities in 2005.
Concentrated Poverty Presents Many Problems • Notably, the regional trends shown in this report augur a reversal of fortune from developments in the 1990s. During that decade, the Midwest and South saw especially sharp declines in the concentration of poverty in their metropolitan areas, while Western metro areas experienced increases. • Indeed, the map of Detroit (Map 3) showing increasing concentrated of working poverty between tax years 1999 and 2005 is almost a mirror image of the city’s decline in high-poverty neighborhoods from 1990 to 2000. • This suggests a possible reversion to longer-term patterns in the spatial organization of poverty in these cities and metro areas, as the booming economy of the late 1990s slowed soon after the decennial census was conducted on April 1, 2000. • Given the backsliding evident by 2005, and the weak economic forecasts ahead, it seems likely that we will finish the current decade having ceded some of the “stunning progress” against concentrated poverty we achieved during the prior decade.
Can policy Make A Difference? • More good jobs • Access to affordable education and health care • A poverty rate that reflects the true cost of living • Supports for components of the cost of living that unexpectedly change
The Take Away • Who Lives in Poverty in America? • Why are they poor? • Have those who are poor changed over time? • Where are the poor located? • Can we eradicate poverty? • What can we learn from history?