Download
1 / 23
230 likes | 397 Views
Balanced Scorecard. Kaplan & Norton : HBR July-August 2005: repeat of 1992 seminal article Feb 2004: Strategy Map Oct 2005: Examples March 2006: Implementation examples. Perspectives. GOALS & PERFORMANCE MEASURES Financial perspective How do we look to shareholders?

E N D
Balanced Scorecard Kaplan & Norton: HBR July-August 2005: repeat of 1992 seminal article Feb 2004: Strategy Map Oct 2005: Examples March 2006: Implementation examples Finland 2010
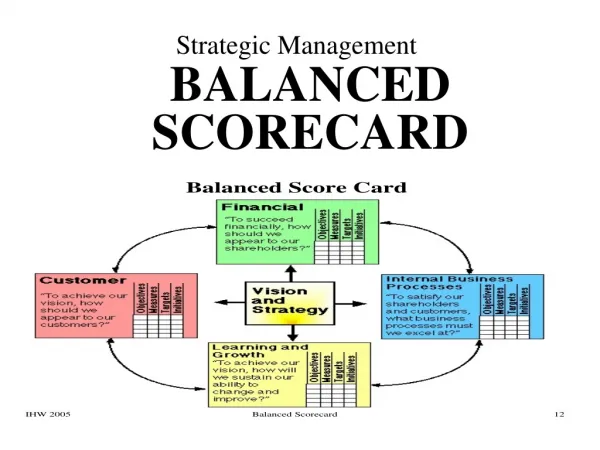
Perspectives • GOALS & PERFORMANCE MEASURES • Financial perspective • How do we look to shareholders? • Customer perspective • How do customers see us? • Internal Business perspective (BPR) • What must we excel at? • Innovation & Learning perspective • Can we continue to improve & create value? Finland 2010
Example: anonymous semiconductor company • FINANCIAL perspective Finland 2010
CUSTOMER perspective Finland 2010
INTERNAL BUSINESS perspective Finland 2010
INNOVATION & LEARNING perspective Finland 2010
2004 article: Strategic Readiness • Strategy map: framework to link intangible assets to shareholder value creation • Through the 4 perspectives • 3 Intangible Asset categories essential to implement strategy (Learning & Growth) • Human Capital • Skills, training, knowledge • Information Capital • Databases, information systems, networks, infrastructure • Organizational Capital • Culture, leadership, alignment with goals, knowledge sharing Finland 2010
Strategy Map: Intangible assets link to Internal Process • Intangible assets make up Learning & Growth perspective • Map to Internal Process perspective • Operations Management • Produce & deliver products & services • Customer Management • Enhance customer value • Innovation • Create new products & services • Regulatory & Social • Improve communities & the environment • Customer perspective • Price, quality, availability, selection, functionality, service, partnership, brand • Financial perspective • Productivity strategy • Improve cost structure • Increase asset utilization • Revenue growth strategy • Enhance customer value • Expand revenue opportunities Finland 2010
Consumer Bank (anonymous) example: Human Capital Finland 2010
Information Capital Readiness Finland 2010
Organization Capital Readiness Finland 2010
SCM & BSCBeasley, Chen, Nunez & Wright, Strategic Finance 87:9 [2006] Finland 2010
Learning & Growth for Employees Finland 2010
Internal Business Processes Finland 2010
Customer Satisfaction Finland 2010
Financial Performance Finland 2010
Gaudenzi & BorghesiThe International Journal of Logistics Management 17:1 [2006] • AHP in balanced scorecard style • Develop formula to evaluate risk within departments • Focus on top level criteria • On-time delivery • Completeness • Correctness • Damage/defect free products Finland 2010
Gaudenzi & Borghesi Weights Finland 2010
Weights: Contingent uponOn-time first vs. Completeness first Finland 2010
On-time delivery evaluation – Manager subjective scores Finland 2010
Completeness evaluation – Managerial subjective scores Finland 2010
Other Business Scorecards in Broader Perspectives • Internal auditing in accounting • Campbell, Adams, Campbell & Rose • Financial Executive 22:1 [2006] • Mental health governance • Sugarman & Kakabadse • The International Journal of Clinical Leadership 16 [2008] Finland 2010
Marketing natural gas vehiclesJanssen, Lienin, Gassmann & Wokaun, Transportation Research Part A 40 [2006] INDICATORS • Ratio of natural gas vehicles per compress natural gas fueling stations • Type coverages (how many different natural gas vehicle types were available) • Natural gas vehicle investment pay-back time • Sales per type • Subsidies par automobile Finland 2010