Download
1 / 27
270 likes | 279 Views
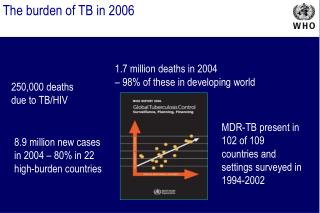
Measuring the burden Surveys of TB infection and disease WPRO Workshop May 2003. Exercises# Measuring the burden of tuberculosis.doc. We want to reduce Morbidity and mortality New infections Recurrence of old infections The infector pool. Routine programme data. Notifications

E N D
Measuring the burden Surveys of TB infection and disease WPRO Workshop May 2003
We want to reduce • Morbidity and mortality • New infections • Recurrence of old infections • The infector pool
Routine programme data • Notifications • Cure rates • Drug resistance • Mortality • Process indicators
But... • Biases • Incompleteness • Recording • Reporting • Analysing • AIDS
Four things we can measure • Prevalence of infection (tuberculin surveys) • Incidence of infection (ARTI) • Incidence of disease • Prevalence of disease • Prevalenc of HIV in TB patients
Measuring the prevalence of infection Tuberculin surveys
Sampling Districts: Probability proportional to size Schools in districts: Random Children in schools: Total sample within schools Sample size Levels of variation Logistical considerations
Tanzania 1983 to 1988 Egypt 1995 to 1997 15 10 5 0 4 2 0 Frequency (%) Frequency (%) BCG BCG No BCG No BCG 0 10 20 30 0 10 20 30 Size of induration (mm) Size of induration (mm) Korea
South Korea 1965 1995 Age (years)
Calculating ARTI(R) from prevalence (P) and age (A) R = 1 – (1 – P)1/A Probability of being infected per year = R Probability of not being infected per year = 1 – R Probability of not being infected after A years = (1 – R)A 1 – P = (1 – R)A 1 – R = (1 – P)1/A
Assumptions The annual risk of infection is constant over time and independent of age. Surveys in school children, aged about 5 to 10 years: estimate of the ARTI is averaged over about five to ten years.
South Korea 10 to 20 years 5 to 10 years
Calculating incidence from the ARTI Styblo showed that for every 1% increase in the annual risk of infection, the incidence of SS+ disease increases by (5010)/100,000/yr. If we multiply the ARTI by 50 this gives us an estimate of the incidence of SS+ TB.
Estimating sample sizes quickly If you count N positives then: N 95% confidence limits 2N Fractional error 2N/N = 2/N Incidence (South Korea, 1990) 40 per 100,000 95% confidence limits 2N = 13 ( 32%) Sample of 800,000 gives 320 positive 11%
South Korea Incidence Survey 1998: Baseline 920,000 had chest radiography 840,000 did not have suspicious CXR 1990: Follow up 790,000 available for CXR 2,500 with suspicious X-rays 2000 had sputa taken 200 smear positive 300 culture positive (smear negative)
South Korea ARTI50 Civil servants
Measuring the prevalence of disease Same problems as for incidence….
The incidence of SS+ tuberculosis plotted against the prevalence of HIV for African countries in 2001.
Age and gender specific incidence of tuberculosis in Kisii, Kenya Green: 1991 to 1993; blue: 1994 to 1998; red: 1999 to 2001. HIV prevalence (%) Age-specific prevalence of HIV among men and women in Carletonville, South Africa, in 1998.