Download
1 / 23
240 likes | 400 Views
The effect of body condition score change 15 days prior to calving on lactation curve and production parameters in grazing dairy cows in Ireland. M.R. Sheehy* 1,2 , F.J. Mulligan 1 , M.A. Crowe 1 , S.P.M . Aungier 1 , and A.G. Fahey 3

E N D
The effect of body condition score change 15 days prior to calving on lactation curve and production parameters in grazing dairy cows in Ireland M.R. Sheehy*1,2, F.J. Mulligan1, M.A. Crowe1, S.P.M. Aungier1, and A.G. Fahey3 1School of Veterinary Medicine, University College Dublin, Ireland 2Devenish Nutrition Ltd., Belfast, Northern Ireland 3 School of Agriculture & Food Science, University College Dublin, Ireland
Introduction • The transition period extends from 3 weeks before to 3 weeks after calving • It is the most critical period of the lactation • Nutrition and energy balance • Production • Metabolic Health Issues • Economic and welfare implications
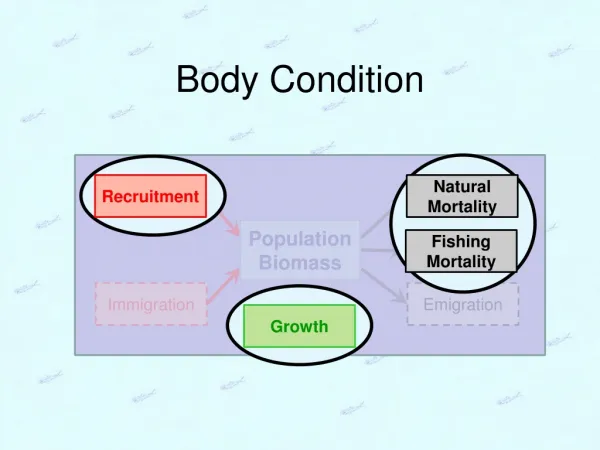
Introduction OUTPUTS INPUTS ENERGY BALANCE Energy balance can be assessed during transition by body condition score change
Previous Studies Have been concerned with the implications of cows reaching target BCS at various stages of lactation (Mulligan, 2012) However, little is known about the effect of BCS change immediately pre-calving on the lactation characteristics of the dairy cow
Objective To determine if change in BCS in the last 15 days before calving has an affect on subsequent lactation characteristics
Materials and Methods • Commercial Irish dairy farm • 98 Spring-calving Holstein-Friesian cows
Treatments • MAIN – cows that maintained BCS 15 d prior to calving • LOSS – cows that lost BCS 15 d prior to calving
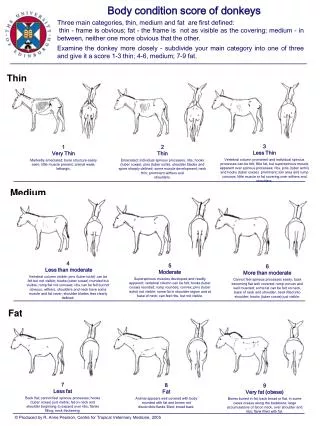
Body Condition Scoring • 1 to 5 BCS scale (Edmonson et al., 1989) • Same trained researcher every 2 weeks • Eliminate inter-observer variation
Milk Sampling • Cows milked at 0700 and 1600 h daily • Milk was sampled every two weeks • Mid infrared spectrophotometry • Milk, fat, and protein yields • Fat, protein, and lactose concentrations • Energy Corrected Milk (KirchgeBner 1997) (Milk yield x 0.3246) + (Fat yield x 12.86) + (Prot yield x 7.04)
Lactation Curve Modelling • Woods Incomplete Gamma Function (Woods, 1967) • Non-linear function • y(t) = atbe-ct • t = time • a = estimate of initial milk yield • b= rate of increase until peak production • c = rate of decrease after peak production
Curve Shape b a c
Lactation Curve Characteristics • Initial milk yield (a) • Rate of increase to peak yield (b) • Rate of decline after peak yield (c) • Lactation persistency (p) • Time at which peak yield is attained (Tm) • Peak yield (Ym)
Statistical Analysis Yijkl = BCS + Ci + Tj + Pk + TPjk + TCij + PCki+ eijkl Yijkl= lactation curve characteristics of the lth cow in ith calving month, the jth treatment, and the kth parity, BCS = covariate of BCS on d -15 Ci = the ith calving month of Jan, Feb, Mar, or Apr Tj= the jth treatment of MAIN or LOSS Pk = the kthparity of 1, 2, or ≥ 3 TPjk= the interaction of the jth treatment and the kthparity TCij= the interaction of the jth treatment and the ithcalving month PCij= the interaction of the kh parity and the ithcalving month eijkl= random residual error
Summary • Overall • MAIN significantly greater initial milk yield (a) than LOSS • MAIN significantly lower SCC than loss • LOSS cows tended to reach peak milk yield sooner • LOSS cows tended to have a faster rate of decline post peak • Parity 1 • MAIN took longer to reach peak milk yield • MAIN lower rate of decline post peak milk yield • MAIN more persistent fat yield curve • Parity 3 • MAIN took longer to reach peak fat yield • MAIN had lower somatic cell count
Conclusion • Ideal lactation curve • Cows that reach peak milk and component yields slowly and remain persistent • More beneficial to the cows’ metabolic and health status (Solkner and Funchs, 1987) • Therefore MAIN parity 1 and parity 3 cows had improved lactation curve characteristics compared to LOSS parity 1 and parity 3
The effect of body condition score change 15 days prior to calving on lactation curve and production parameters in grazing dairy cows in Ireland M.R. Sheehy*1,2, F.J. Mulligan1, M.A. Crowe1, S.P.M. Aungier1, and A.G. Fahey3 1School of Veterinary Medicine, University College Dublin, Ireland 2Devenish Nutrition Ltd., Belfast, Northern Ireland 3 School of Agriculture & Food Science, University College Dublin, Ireland
Lactation Curve Characteristics • Initial milk yield (a) • Rate of increase to peak yield (b) • Rate of decline after peak yield (c) • Lactation persistency (p) • p = -(b+1)*ln(c) • Time at which peak yield is attained (Tm) • Tm =b/c • Peak yield (Ym) • Ym = a(b/c)be-b