Download
1 / 33
370 likes | 568 Views
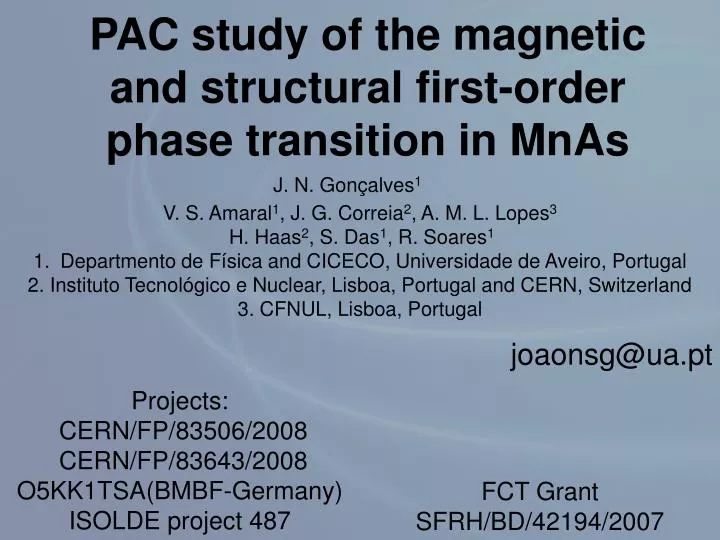
PAC study of the magnetic and structural first-order phase transition in MnAs. V. S. Amaral 1 , J. G. Correia 2 , A. M. L. Lopes 3 H. Haas 2 , S. Das 1 , R. Soares 1 Departmento de Física and CICECO, Universidade de Aveiro, Portugal

E N D
PAC study of the magnetic and structural first-order phase transition in MnAs • V. S. Amaral1, J. G. Correia2, A. M. L. Lopes3 • H. Haas2, S. Das1, R. Soares1 • Departmento de Física and CICECO, Universidade de Aveiro, Portugal • 2. Instituto Tecnológico e Nuclear, Lisboa, Portugal and CERN, Switzerland • 3. CFNUL, Lisboa, Portugal J. N. Gonçalves1 joaonsg@ua.pt Projects: CERN/FP/83506/2008 CERN/FP/83643/2008 O5KK1TSA(BMBF-Germany) ISOLDE project 487 FCT Grant SFRH/BD/42194/2007
Outline • MnAs/Motivation • TDPAC experimental details and results • Magnetization, XRD results • Ab-initio calculations • Conclusion
MnAs • Studied since 1904 1904 - F. Heusler, Z. Angew. Chem. 17 260 1911 - S. Hilpert and T. Dieckmann, Ber. Dtsch. Chem. Ges. A 44 2378 (Ferromagnetic) 1947 - A. Serres, Journal de Physique et le Radium 8(5):146-151 1954 - B. T. Willis M and Rooksby H P Proc. Phys. Soc. London B 67 290 1962 – C. P. Bean, D. S. Rodbell Physical Review 126(1):104 ...
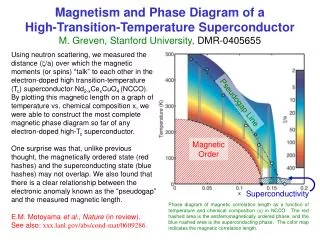
Unusual transition • Magnetocaloric effect • (C. Kuhrt et al., Phys. Status Solidi A 91, 105 1985) • Spin injector for Spintronics • (Daweritz Rep. Prog. Phys. 69 2581 2006) • Magnetoresistance effect • (J. Mira et al., PRL 90 09273 2003) • Spin-Phonon Coupling • (J. Łazewski et al., PRL 104, 147205 2010 ) • ...
MnAs Phases Low temperature Hexagonal structure (NiAs-type) Ferromagnetic metal Orthorhombic structure (MnP-type), Paramagnetic(?) • 1st order phase transition at 42 C • Increasing temperature: • 2% volume loss • Hexagonal-Orthorhombic • Loss of Ferromagnetism • Increase in resistivity Between 42 C and 120 C the orthorhombic distortions disappear and the structure becomes again hexagonal of NiAs-type, paramagnetic (Curie-Weiss).
Magnetoresistance effect “Colossal-like” Magneto-resistance Neutron diffraction measurements and Magneto-Resistance effect. J. Mira et al., Phys. Rev. Lett. 9 097203 2009
Hyperfine Interactionsin MnAs Mössbauer NMR • B. Kirchschlager et al., Physics Letters. 1981;82(1):46-50. • Mn0.75Fe0.25As • No hyperfine field. • S. Pinjare and K. Rama Rao, Journal of Magnetism and Magnetic Materials, 30, 27 (1982) • Double signals from Mn and As, attributed to nuclei at edge and centers of domain walls. • Anomaly at -50 C, due to atoms at domain walls. • M. A. Abdelgadir et al., Physica Scripta 37(3):373-380(1988) • MnxFe1-xAs, with x=0.01, 0.03 and 0.15. • Hyperfine at the Fe probe is very small, or follows unusual dependence • TC,d=2C for x=0.01 .
Perturbed Angular Correlations • Radioactive beam of selected isotope probes, implanted in the sample in vaccum • Highly diluted concentrations of probes (parts per million)
PAC t a r g e t i o n s o u r c e protons E~1GeV CERN’s Proton-Synchroton Booster
Quadrupole electric moment interacts with Electric Field Gradient (EFG) Vzz(1021 V/m2) η=|Vxx-Vyy|/Vzz Magnetic dipole moment with Magnetic Hyperfine Field Bhf(T) MATERIAL SPECIFIC Interaction Frequencies: EXPERIMENTAL OUTPUT • Local scales of length (nm or Å) and time (ns) Numerical fit of the hamiltonian of the hyperfine interactions. All the fit parameters have physical meaning: ω0, η, ωL,,σ ω0: frequency of the electric quadrupole interaction η : axial asymmetry parameters of electric quadrupole interaction ωL: frequency of the magnetic dipole interaction σ: damping of the perturbation spectrum is simulated by a Lorentzian function of width σ
Heating (chronological order) • Ferromagnetic phase: nuclei interacting with a magnetic hyperfine field; EFG is too small to be resolved (< 1 x 10²¹ V/m2). • Orthorhombic Phase: low electric field gradient ( less than 1.1 x 10²¹ V/m2) • η=0 • For all cases, a constant fraction of nuclei interacting with a higher EFG must be considered, which we attributed to defects which were not annealed.
141 – Above the second order transition. Continues with low Vzz and no MHF. • Hysteresis clearly seen when comparing with previous 41.5 C (heating) with 41 C(cooling).Hel Between 21.2 and 35 C the sample was heated to 100 C.
2nd set of experiments First-order Transition
21.2, 40.8, 41.4: fraction of Hyperfine magnetic field (B) 70% • Within 1 C, the hyperfine field fraction disappears, but the hyperfine field is still large at 42.3 C, where phase coexistence is seen. • Including am EFG in fits of all the spectra. Constant EFG, with constant fraction 30%. Accounts for perturbed environments remaining after annealing.
Entering low T phase with TC,d(Curie temperature when decreasing T) 10 degrees lower than TC,I .
Fit parameters • The attenuation of the hyperfine field (σ1)increseases towards the phase transition, and decreases when going away from the transition. • Dynamic processes near the transition such as spin fluctuactions may be responsible for this increase of attenuation.
TC,i = 42.3-43.5 C TC,d = 30-32.6 C ΔThysteresis = 9.7-13.5 C At a given T, the hyperfine field is the same, irrespective of cooling or heating the sample. Red: heating Blue: cooling White: previous experiments
Low temperature PAC measurements • There is a change of the MHF derivative around 140 K. • Hyperfine field also shows anomalous measurements at that region.
Magnetization Transition width = 2-3 C TC,i = 42 C TC,d = 32 C PAC: 41.3, 42.3, 43.5 C PAC: ΔThysteresis = 9.7-13.5 C
X-ray diffraction Measurements on three 2θ ranges, 31.4-32.6, 41.8-43 and 48.6-50º. (101) (102) (110)
Wien 2k code P. Blaha et al., TUVienna Basis APW+lo /LAPW. Periodic - Supercells to include probes in small concentrations Optimization of structural parameters, by minimization of total energy or calculated forces. Generalized Gradient Approximation (PBE) LDA gives poor results for MnAs (Zhao et al., Phys. Rev. B 35, 113202) Spin-polarized calculations (collinear), Ferromagnetism due to Mn atoms at the hexagonal phase.
Hyperfine Parameters – pure MnAs Exp. Room Temperature lattice constants Calculations are exact only for T=0 K Exp. Low temperature lattice constants
Supercells MnAs1-xSex Mn1-xAsSex • We consider the Se probe at the possible substitutional sites (As/Se) MnAs15/16Se1/16 MnAs1/16Se5/16
Hyperfine Parameters Concentration: 1/16 of As atoms are subsituted by Se atoms. Vzz exp. ~ 0 Bhf. exp. ~ 50 T
Hyperfine Parameters Is the concentration low enough to reproduce the diluted impurity (parts per million) experimental situation?
Hyperfine Parameters • What is the favorable site for the probe in the orthorhombic phase? MnAs47/48Se1/48 Mn47/48AsSe1/48 Vzz ~ 11 V/Å2
Heat Formation Energies In the hexagonal phase: Se subs. Mn: 2.84 eV Se subs. As: 0.03 eV -> lower energy The assignemt obtained with with the hyperfine parameters, is confirmed buy the heat formation energies. 2x2x2 supercell
Conclusions • Transition measured at the atomic level. Coexistence of phases measured in a small interval ( less than 2 C). • First principles calculations are in good agreement with the low T hyperfine field, considering the probe Se substitutional at the As site. • The phase fractions are measured by PAC, showing that the magnetization changes are mostly due to the change of phase fractions, which can be correlated with the XRD measurements. • Hysteresis is seen also from a microscopic point of view, consistent with the XRD and magnetization results.
In this case the hyperfine field masks the electric field gradient. The EFG is very low, due to the low quadrupole moment of the probe at the high symmetry of the position. Other isotopes:172Lu
1947 - A. Serres, Journal de Physique et le Radium 8(5):146-151 Why is it still studied?