Download
1 / 1

E N D
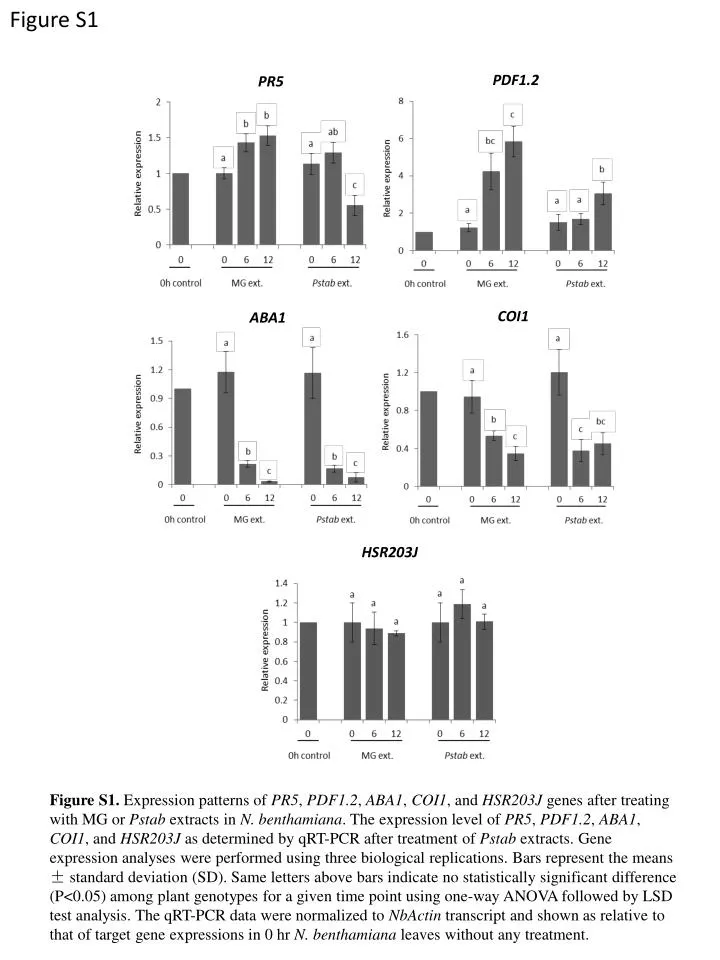
Figure S1 PDF1.2 PR5 COI1 ABA1 HSR203J • Figure S1. Expression patterns of PR5, PDF1.2, ABA1, COI1, and HSR203Jgenes after treating with MG or Pstab extracts in N. benthamiana. The expression level of PR5, PDF1.2, ABA1, COI1, and HSR203J as determined byqRT-PCR after treatment of Pstab extracts. Gene expression analyses were performed using three biological replications. Bars represent the means ± standard deviation (SD). Same letters above bars indicate no statistically significant difference (P<0.05) among plant genotypes for a given time point using one-way ANOVA followed by LSD test analysis. The qRT-PCR data were normalized to NbActin transcript and shown as relative to that of target gene expressions in 0 hr N. benthamiana leaves without any treatment.