Download
1 / 9
130 likes | 219 Views
Making Science Graphs and Interpreting Data. Scientific Graphs. Most scientific graphs are made as line graphs. There may be times when other types would be appropriate, but they are rare.

E N D
Scientific Graphs • Most scientific graphs are made as line graphs. There may be times when other types would be appropriate, but they are rare. • The lines on scientific graphs are usually drawn either straight or curved. These "smoothed" lines do not have to touch all the data points, but they should at least get close to most of them. They are called best-fit lines. • In general, scientific graphs are not drawn in connect-the-dot fashion.
Directly Proportional and Inversely Proportional Graphs Directly Proportional Inversely Proportional As the independent variable increases, the dependent variable increases as well. As the independent variable increases, the dependent variable decreases.
Predicting Data on a Graph • Graphs are a useful tool in science. The visual characteristics of a graph make trends in data easy to see. • One of the most valuable uses for graphs is to "predict" data that is not measured on the graph. • Extrapolate: extending the graph, along the same slope, above or below measured data. • Interpolate: predicting data between two measured points on the graph.
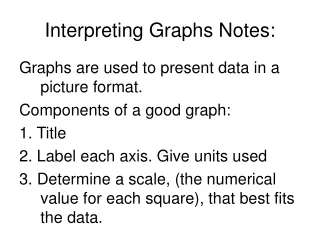
How to Construct a Line Graph • Identify the variables • Independent variable -Goes on the X – axis (horizontal) -Should be on the left side of a data table • Dependent variable -Goes on the Y – axis (vertical) -Should be on the right side of a data table 2.Determine the scale of the Graph • Determine a scale (numerical value for each square) that best fits the range of each variable • Spread the graph to use MOST of the available space
How to Construct a Line Graph 3. Number and Label Each Axis a. This tells what the lines on your graph represent. Label each axis with appropriate units. 4. Plot the Data Points a. plot each data value on the graph with a dot. 5. Draw the Graph a. draw a curve or line that best fits the data points. b. Most graphs of experimental data are not drawn as “connect the dots”. 6. Title the Graph a. Your title should clearly tell what the graph is about. b. If your graph has more than one set of data, provide a key to identify the different lines.
Graphing Practice Problem #1a Graph the data. What does the graph represent?
Graphing Practice Problem #1b A. What type of motion does this graph represent? B. Put the data from this graph into a table.
Graphing Practice Problem #1c • Describe what happens during the time represented by this graph. B. Put the data from this graph into a table.