Download
1 / 1
10 likes | 136 Views
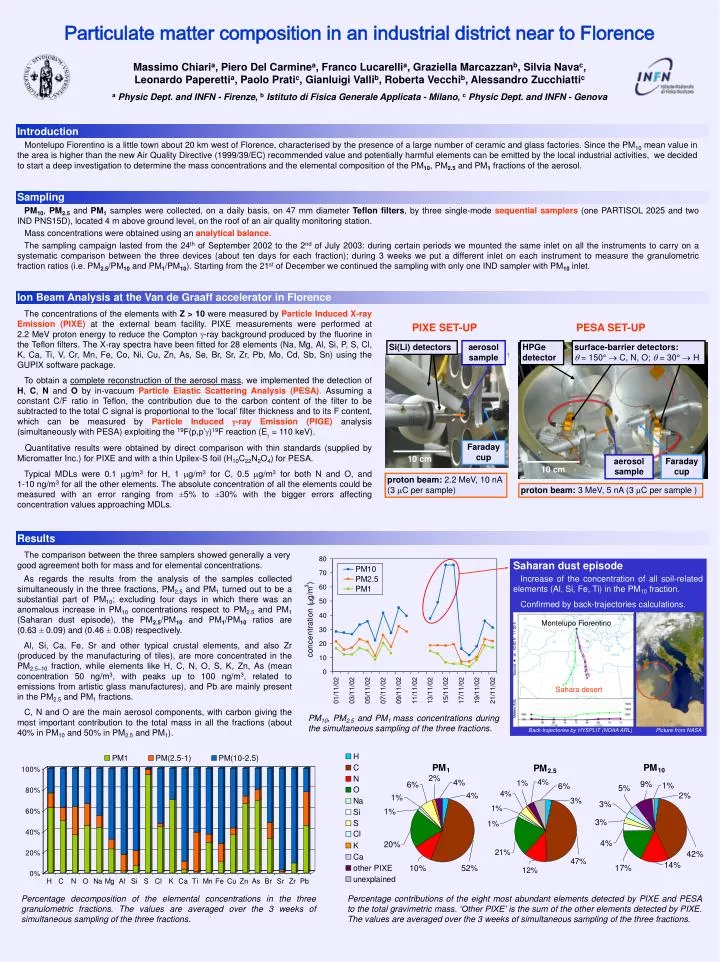
10 cm. 10 cm. Saharan dust episode. Increase of the concentration of all soil-related elements (Al, Si, Fe, Ti) in the PM 10 fraction. Confirmed by back-trajectories calculations. Montelupo Fiorentino. Sahara desert. Back-trajectories by HYSPLIT (NOAA ARL). Picture from NASA.

E N D
10 cm 10 cm Saharan dust episode Increase of the concentration of all soil-related elements (Al, Si, Fe, Ti) in the PM10 fraction. Confirmed by back-trajectories calculations. Montelupo Fiorentino Sahara desert Back-trajectories by HYSPLIT (NOAA ARL) Picture from NASA Particulate matter composition in an industrial district near to Florence Massimo Chiaria, Piero Del Carminea, Franco Lucarellia, Graziella Marcazzanb, Silvia Navac,Leonardo Paperettia, Paolo Pratic, Gianluigi Vallib, Roberta Vecchib, Alessandro Zucchiattic aPhysic Dept. and INFN - Firenze, bIstituto di Fisica Generale Applicata - Milano, cPhysic Dept. and INFN - Genova Introduction Montelupo Fiorentino is a little town about 20 km west of Florence, characterised by the presence of a large number of ceramic and glass factories. Since the PM10 mean value in the area is higher than the new Air Quality Directive (1999/39/EC) recommended value and potentially harmful elements can be emitted by the local industrial activities, we decided to start a deep investigation to determine the mass concentrations and the elemental composition of the PM10, PM2.5 and PM1 fractions of the aerosol. Sampling PM10, PM2.5 and PM1 samples were collected, on a daily basis, on 47 mm diameter Teflon filters, by three single-mode sequential samplers (one PARTISOL 2025 and twoIND PNS15D), located 4 m above ground level, on the roof of an air quality monitoring station. Mass concentrations were obtained using an analytical balance. The sampling campaign lasted from the 24th of September 2002 to the 2nd of July 2003: during certain periods we mounted the same inlet on all the instruments to carry on a systematic comparison between the three devices (about ten days for each fraction); during 3 weeks we put a different inlet on each instrument to measure the granulometric fraction ratios (i.e. PM2.5/PM10 and PM1/PM10). Starting from the 21st of December we continued the sampling with only one IND sampler with PM10 inlet. Ion Beam Analysis at the Van de Graaff accelerator in Florence The concentrations of the elements with Z > 10 were measured by Particle Induced X-ray Emission (PIXE) at the external beam facility. PIXE measurements were performed at2.2 MeV proton energy to reduce the Compton g-ray background produced by the fluorine in the Teflon filters. The X-ray spectra have been fitted for 28 elements (Na, Mg, Al, Si, P, S, Cl, K, Ca, Ti, V, Cr, Mn, Fe, Co, Ni, Cu, Zn, As, Se, Br, Sr, Zr, Pb, Mo, Cd, Sb, Sn) using the GUPIX software package. To obtain a complete reconstruction of the aerosol mass, we implemented the detection of H, C, N and O by in-vacuum Particle Elastic Scattering Analysis (PESA). Assuming a constant C/F ratio in Teflon, the contribution due to the carbon content of the filter to be subtracted to the total C signal is proportional to the ‘local’ filter thickness and to its F content, which can be measured by Particle Induced g-ray Emission (PIGE) analysis (simultaneously with PESA) exploiting the 19F(p,p’g)19F reaction (Eg = 110 keV). Quantitative results were obtained by direct comparison with thin standards (supplied by Micromatter Inc.) for PIXE and with a thin Upilex-S foil (H10C22N2O4) for PESA. Typical MDLs were 0.1 mg/m3 for H, 1 mg/m3 for C, 0.5 mg/m3 for both N and O, and1-10 ng/m3 for all the other elements. The absolute concentration of all the elements could be measured with an error ranging from ±5% to ±30% with the bigger errors affecting concentration values approaching MDLs. PIXE SET-UP PESA SET-UP Si(Li) detectors aerosol sample HPGe detector surface-barrier detectors:q = 150° C, N, O; q = 30° H Faraday cup aerosol sample Faraday cup proton beam: 2.2 MeV, 10 nA (3 mC per sample) proton beam: 3 MeV, 5 nA (3 mC per sample ) Results The comparison between the three samplers showed generally a very good agreement both for mass and for elemental concentrations. As regards the results from the analysis of the samples collected simultaneously in the three fractions, PM2.5 and PM1 turned out to be a substantial part of PM10; excluding four days in which there was an anomalous increase in PM10 concentrations respect to PM2.5 and PM1 (Saharan dust episode), the PM2.5/PM10 and PM1/PM10ratios are(0.63 ± 0.09) and (0.46 ± 0.08) respectively. Al, Si, Ca, Fe, Sr and other typical crustal elements, and also Zr (produced by the manufacturing of tiles), are more concentrated in the PM2.5–10 fraction, while elements like H, C, N, O, S, K, Zn, As (mean concentration 50 ng/m3, with peaks up to 100 ng/m3, related to emissions from artistic glass manufactures), and Pb are mainly present in the PM2.5 and PM1 fractions. C, N and O are the main aerosol components, with carbon giving the most important contribution to the total mass in all the fractions (about 40% in PM10 and 50% in PM2.5 and PM1). PM10, PM2.5 and PM1 mass concentrations during the simultaneous sampling of the three fractions. Percentage decomposition of the elemental concentrations in the three granulometric fractions. The values are averaged over the 3 weeks of simultaneous sampling of the three fractions. Percentage contributions of the eight most abundant elements detected by PIXE and PESA to the total gravimetric mass. ‘Other PIXE’ is the sum of the other elements detected by PIXE. The values are averaged over the 3 weeks of simultaneous sampling of the three fractions.