Download
1 / 37
370 likes | 383 Views
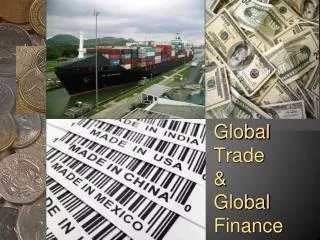
Global Inequality and Global Finance. A Presentation to the IDEAS Workshop on Financial Crime and Fragility under Financial Globalization New Delhi December 19, 2005. by James K. Galbraith The University of Texas at Austin. The University of Texas Inequality Project.

E N D
Global Inequality and Global Finance A Presentation to the IDEAS Workshop on Financial Crime and Fragility under Financial Globalization New Delhi December 19, 2005
by James K. Galbraith The University of Texas at Austin The University of Texas Inequality Project http://utip.gov.utexas.edu
The Standard Question: Has Inequality been Rising or Falling? Three ways to measure it, per Milanovic, 2002 • Un-weighted Between-Country (has been rising in all studies) • Weighted Between-Country (has fallen mainly because of China) • Within-country “True”(disputed territory) ?
Stanley Fischer compares inequality types 1 and 2, 1980-2000. ( 2003 Ely Lecture) Note that this approach says nothing about inequality within countries
Existing studies of “true” world income inequality give conflicting results, recently surveyed by Milanovic Including Sala-i-Martin’s claim that inequality has been steadily declining…based on Deininger and Squire. Figure borrowed from Milanovic
Coverage of Deininger and Squire Version of D&S used by Dollar and Kraay, “Growth is good for the poor.”
Inequality in Asia according to Deininger and Squire Indonesia and India have highly unequal pay. So how do they arrive at highly equal incomes – more equal than Australia or Japan? Through a strong redistributive welfare state? Probably not. Or, if low Ginis in those countries reflect egalitarian but impoverished agriculture – as many who use these data believe -- then why are the D&S Ginis so high in agrarian Africa?
The U.T. Inequality Project • Measures Global Pay Inequality • Uses Simple Techniques that Permit Up-to-Date Measurement at Low Cost • Uses International Data Sets for Global Comparisons, especially UNIDO’s Industrial Statistics • Has Many Regional and National Data Sets as well, including for Europe, Russia, China, India, and the U.S.
A brief review of the Theil Statistic: The “Between-Groups Component” n ~ employment; ~ average income; j ~ subscript denoting group
First Advantage Said the Bi-Colored Python Rock Snake Many Observations
Let’s look at the average values in the UTIP -UNIDO data set, with averages taken over all available observations, 1963-1999. UTIP-UNIDO measures show China and Australia as the most egalitarian countries in the Asian region; India and Indonesia show high inequality on these measures.
Lowest Inequality In the Americas
Second Advantage Plentiful Historical Detail
Revolution War Tiananmen Banking Crisis Falklands War Military Coup Data for China drawn partly from State Statistical Yearbook
Third Advantage Worldwide Patterns
With the UTIP data, we can review changes in global inequality both across countries and through time.
The Scale Brown: Very large decreases in inequality; more than 8 percent per year. Red Moderate decreases in inequality. Pink: Slight Decreases. Light Blue: No Change or Slight increases Medium Blue: Large Increases -- Greater than 3 percent per year. Dark Blue: Very Large Increases -- Greater than 20 percent per year. h
1970 to 1976 The oil boom: inequality declines in the producing states, but rises in the industrial oil-consuming countries, led by the United States.
1981 to 1987 … the Age of Debt Note the exceptions to rising inequality are mainly India and China, neither affected by the debt crisis…
1988 to 1994 The age of globalization… Now the largest increases in inequality in are the post-communist states; an exception is in booming Southeast Asia, before 1997…
Fourth Advantage Finding A Global Pattern
A regression of pay inequality on GDP per capita and time, 1963-1998. The downward sloping income-inequality relation holds, but with an upward shift over time…
Milanovic Unweighted Inequality Between Countries Collapse of Bretton Woods Debt Crisis
Actual and Simulated Mean Pay Inequality in Rich and Poor Countries Without Global Component Actual UTIP-UNIDO
Conclusions: Inequality rose in most countries in the age of globalization… Rising inequality is an issue of global finance. It is a matter of global, not national governance, especially high interest rates and debt crises. Some day, we’ll need a new world financial system to deal with this; Meanwhile sauve qui peut .