Download
1 / 29
290 likes | 386 Views
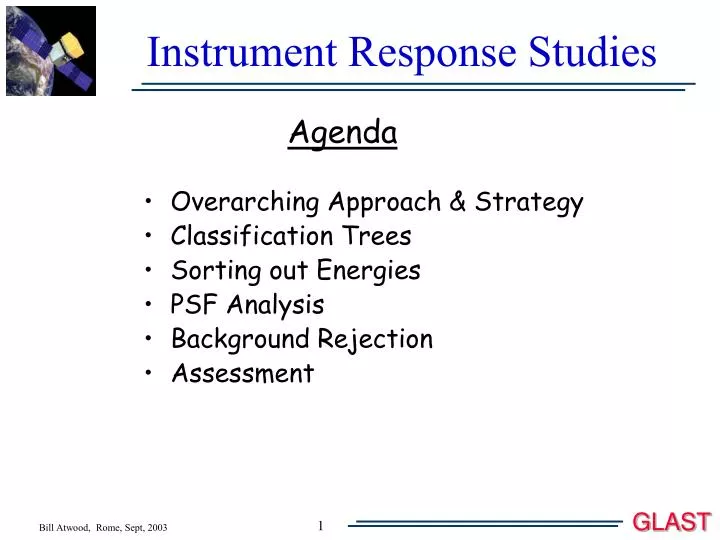
Agenda Overarching Approach & Strategy Classification Trees Sorting out Energies PSF Analysis Background Rejection Assessment. Instrument Response Studies. Overarching Approach & Strategy. A 3 Stage Approach 1. Energy determination - Foundational to what follows

E N D
Agenda Overarching Approach & Strategy Classification Trees Sorting out Energies PSF Analysis Background Rejection Assessment Instrument Response Studies
Overarching Approach & Strategy A 3 Stage Approach 1. Energy determination - Foundational to what follows 2. Evaluate PSF's - Background will be suppressed 3. Reject the Background - The hard part Statistical Tools: Classification Trees & Regression Trees
A Brief History of Resolution & Rejection • Preparing for DC1 is a LARGE TASK • - Not likely to get right the 1st, or the 2nd, or the 3rd, or.... time! • 1st Time: April-May • Discover Mult-scattering in G4 "too good to believe!" • Took till end of June to fix! • 2nd Time: July (SAS Workshop) • OOPS! The ACD geometry! • 3rd Time: July-August • Where did all the Run Numbers go? • 4th Time: August • Will Bill never stop changing variable - well at least • he shouldn't make so many coding errors! Steve's variables added. • 5th Time: August-September • Data of the day! But its certainly not "The rest of the story!" • 6th Time: .... IS A CHARM!
Classification Tree Primer A Simple Classification Tree Origin: Social Sciences - 1963 How a CT works is simple: A series of “cuts” parse the data into a “tree” like structure, where final nodes (leaves) are “pure” A "traditional analysis" is just ONE path through such a tree. Tree are much more efficient! Mechanism of tree generation less subject to "investigator basis." Nodes Leaves STATISTICALLY HONEST!
Input Data for Training and Testing "Tree Production" automated by using "Training Samples" where the results are a priori known AG Total: 3/4 x 106 Events All-Gammas (AG): 18 MeV < Eg < 18 GeV 1/E Spectrum -1 < cos(q) < 0 (2p str) AGEN = 6 m2 Background Events(BGEs): 0: Orbit Ave CHIME 1: Albedo Protons 2: Albedo gs 3: Cosmic e- 4: Albedo e+ &e- AGEN = 6 m2 CAL -Training 25% PSF -Training 50% BKG -Training/Testing 25% BKG Total: . 9 x 50 x 106 Events BKG -Training 50% BKG -Testing 50%
Energy Filtering Problem: The large gaps in the CAL and the thick layers of the Tracker compromise the energy determination. Strategy: Identify poorly measured events and eliminate them. Technique: Split events into classes and for each class use a Classification Tree to determine the well-measured events. Splits Trees Energy Class Definitions CAL-Hi: CalEnergySum > 100 MeV CalTotRLn > 2 CAL-Low: CalEnergySum < 100 MeV CalEnergySum > 5 MeV CalTotRLn > 2 No-CAL: CalEnergySum < 5 MeV or CalTotRLn < 2 Program Logic
Energy Filtering (2) Energy Class Breakdown CAL-Hi: 41% CAL-Low: 14% No-CAL: 45% The No-CAL are presently not analyzed. These will need to be addressed in the future as it constitutes the largest Energy Event Class and could greatly improve the transient response CT Energy Classes: "GoodEnergy" = (sEnergy < 35%) CAL-Hi CAL-Low "GoodEnergy" / "BadEnergy" Event Breakdown by Energy Class
Energy Filtering (3) All available variables bearing on the quality of the energy determination are made available to "train" CAL-High CT Probabilities CAL-Low CT Probabilities All Good Good All Good Bad Bad
Eff. = 82% Bad-Cal = 4.5% Energy Filtering (4) Cut: Cal.Prob > .50 After Before
Energy Filtering (5) The Results: Cut more severe as events near Instrument Axis We can use this for SCIENCE! Over Estimates "Clean" Some Low Energy Straglers
PSF Filtering Global Cuts: 1) Cal.Prob > .50 (-18%) Cleaning Cuts Applied to CT Training 2)EvtTkr1EChisq < 7.5 & EvtTkr1EFirstChisq < 10. & EvtTkr2EChisq < 10. & EvtTkr2EFirstChisq < 10 (-5.6%) TOTAL LOSS: -22.5% (Training) -18% (Analysis) Program Logic CT & RT Determinations Topology Splits Energy Cut Thin / Thick Split: Best Track originates in Thin / Thick Radiators 48% Thin / 52% Thick VTX / 1Tkr Split: Use CT to determine whether or not to use Recon VTX Solution 1 CT & 1 RT Used for each of the 4 PSF Classes: CT used to kill long tail RT used to sharpen CORE resolution
PSF Filtering: VTX/1Tkr Split Only events with a VTX solution are considered (VtxAngle > 0) Using MC Truth, the best solution is determined (for CT Training) Mariginal Improvement: Purity (Before/After) 60% / 66% (See Discussion at end of talk)
PSF Tails "Tail" Events defined as being 2.3 x PSF Model or worse. Improvement: 38% of the "Tail" is eliminated at expense of 13.5% of the "Core"
PSF CORE Event-by-Event PSF Error Energy Compensated by: Collapse All PSF's onto one. Normalization: 1 = PSF(68) Sci. Req. Tool: Regression Tree (Similar to CT) Matches deviations rather then class types. Event Starvation VERY APPARENT! Testing Training Measured Deviation Measured Deviation Predicted Deviation Predicted Deviation
4 3 1 2 3 4 1 2 PSF Summary PSF Class Breakdown: Thin-VTX: 15.3% Thin-1Tkr: 32.7% Thick-VTX: 15.9% Thick-1Tkr: 36.0% PSF Clean-up Cuts: Matrix of 4x4 PSF Plots vs Log(E) examined Pred. PSF: Sharpen PSF Core Cut: Limit PSF tails
Thin PSF's - Integrated over FoV 4 Combinations of Cuts (CORE/Pred) Cuts: 2/1 Cuts: 1/1 Meets SR Events Eff.: 94.5% Ratio 95/68 > 3 Cuts: 3/4 Cuts: 3/2 Events Eff.: 52.3% Events Eff.: 19.1%
6.0o 3.5o Min. CORE Cut: >.15 PSF Summary - Minimum CORE Cut PSFs given prior to Background Rejection due to lack of statistics Background rejection does not change conclusions. Limited statistics don't allow for good determination of PSF vs cos(q) for tight cuts Thick Radiator PSF PSF(Thick) = 2 x PSF(Thin) CORE Cut and Pred. CORE are adjusted to have similar effects as for Thin Radiators
Aeff Summary - Minimum CORE Cut Lack of events makes determination imprecise! Effective Area On Axis (Eg > 3 GeV) Aeff= NObs/NGen x 6 x 1.3 Aeff = 2603/18750 x 7.8 Aeff = 1.1 m2 Light Gathering Power (Eg > 3 GeV) Aeff x DW = NObs/NGen x 6 x 2p x 1.27 Aeff x DW = 9877/187500 x 37.7 x 1.27 Aeff x DW = 2.5 m2-str 135/bin asymptotic Note: On Axis Roll-Off -1<cos(q)<-.80 -.80<cos(q)<-.60 Angular Dependence ~ Linear in cos(q) At low energy FoV is truncated Slight roll-over near axis due to CAL inefficiency caused by inter-tower gaps -.40<cos(q)<-.20 -.60<cos(q)<-.40
Background Rejection First Analysis Cut: Require "GoodCal" Energy Results in 18% loss in g Events Distribution of Event Loss in cos(q) Pre-Analysis Filtering Done to reduce data volume Require at least 1 Reconstructed Track Require AcdActiveDist < -20 mm (AcdActiveDist defined to be distance to edge of nearest hit Acd Tile. Values < 0 indicate projected track falls OUTSIDE of hit tile area.) Note: This has a built in Energy Dependence! Generated: 50 x 106 Lost 10% from failed jobs: 45 x 106 Number of Triggers: ~ 18.5 x 10⁶ Number left after pre-filter: .73 x 106 Lost Event Distributions 3.16-18 GeV 560-3160 MeV 100-560 MeV 18-100 MeV Background Event Efficiency: 12.2% BGE Left: 89.3 x 10³ BGE Trigger Reduction Factor: ~200
Background Rejection Event Files • BGE sample divided in 2: • 50% Training for CT's • 50% Testing results • (44652 Events in each) • Remaining AG sample (25% of original) • 50% Training (12.5% of original) • 50% Testing (12.5% of original) • BGE's and AG's tagged and mixed randomly together for • both Training and Testing • This leaves to few events to do much more then • explore BGE Rejection problem areas. • (i.e. 5629 AG's in each)
Background Rejection Program Selection / CT Program Logic Energy Events with a found VTX have much less background Large energy dependence suggests subdividing into Low/Hi branches Large rejection Variables used in Pre Selections Event Topology PSF Tails Low/Hi Energy Event Topology PSF Tail Elimination 25.1% 36.1% .1 Hz E > 350 AG Eff. YES VTX? NO 11.0% 74.8% 82.4% .6 Hz .5 Hz CORE > .5 38.7% 26.7% BGE Rate 10.9 Hz 24.2 Hz 1.3 Hz E > 450 12.0% 10.3 Hz 9.0 Hz
Background Rejection Program - Pre Selection Pre Selection Cuts 0ut of 27.4% (84.7%) Low/Hi Energy 23.2% .04 Hz EvtTkrEComptonRatio > .60 & CalMIPDiff > 60. 25.1% .1 Hz E > 350 AcdTileCount == 0 & CalMIPDiff > -125 & EvtTkrEComptonRatio > .80 8.4% .08 Hz 20.7% (40.6%) 11.0% .5 Hz AG Eff. % in Blue show Rel. Eff. to Event Sample in that Branch AcdTotalEnergy < 6.0 & EvtTkrComptonRatio > .70 & CalMIPDiff > 80. & CalLRmsRatio < 20. BGE Rate 23.1% .26 Hz 27.8% (83.1%) 26.7% 1.3 Hz E > 450 AcdTileCount == 0 & EvtTkrComptonRatio > 1. & CalLRmsRatio > 5. & Tkr1FirstLayer != 0 & Tkr1FirstLayer < 15 12.0% 24.3% (22.6%) 5.5% .25 Hz 9.0 Hz
6828 AG's to start with. Background Rejection Program - CT's VTX & Hi-E Case Training Sample Note the lack of events! Few Events results in sparse CT Trees Testing Results Retention: AG: 97.5% BGE: 22.%
Background Rejection Program - CT Results Case CT Tree Disc. 0ut of 27.4% (82.5%) 23.2% .04 Hz 22.6% .01 Hz Hi- E Prob.Gam > .5 VTX (350 MeV) 20.7% (24.2%) 5.0% .02 Hz 8.4% .08 Hz Low- E Prob.Gam > .9 23.1% .26 Hz 27.8% (77.3%) 21.5% .02 Hz Hi- E Prob.Gam > .5 1Tkr (450 MeV) 24.3% (7.4%) 1.8% .02 Hz 5.5% .25 Hz Low- E Prob.Gam > .9
Background Rejection Program - What's Left? Remaining BGE's 3 Classes of BGE Events Remain: 1) 1:1 Correlated Events - ACD Leakage and inefficiency (.04 Hz) 2) 1: -1 Correlated Events - Range-outs from below (.025 Hz) 3) Events at McZDir ~ 0 - Horizontal Events (.005 Hz) Elimination Strategy 1) ACD Leakage - Events found accurately; - Small phase space - Track projection to ACD cracks 2) Range-outs - MIP Identification in CAL 3) Horizontal Events - Edge CAL hits Aeff & BGE Rate: Aeff = 8400 cm2 on Axis (E > 3 GeV) Aeff x DW = 2.0 m2-str BUT.... BGE Rate 5X too high
Back to CT Basics CT Tree Generation Mechanism: Variable Selection: This is a FIRST ORDER TECHNIQUE When MEANS are approx. equal it fails! This is the case for MOST OF GLAST BGE / SIGNAL Variables! • Example: • One of the most useful • separation variables: • Energy compensated • Cal-Centroid - Track distance • Means similar - Tails dissimilar
A New CT Mechanism 1. Characterize Distribution extents (tails) by Quantiles Example: 95% containment PSF is the 95th Quantile of the PSF distribution Alternative Variable Selection: Q(Good, 95) - Q(Bad, 95) or - normalized... Use Generic for cut placement. 2. CT Generation is a "one step look ahead" - extend to 2,3, etc. steps 3. More Advanced CT Technologies - Ensembles, Boosted Trees, etc.
Iteration #6: Charm! 1. Switch over to Onboard Flight Software Filter for "pruning" Look Ahead: Refiltered Events using FSW Filter MINUS bit #17 ("No Tracks") Remaining Events Kills - 3% of AG sample (Leaves Aeff ~ 8000 cm2 (E > 3 GeV) and Aeff x DW = 1.9 m2-str) Kills - 60% of BGE sample (Rate: .03 Hz) 2. Run at least 5X more events! In fact we should consider simply starting a regular MC production regime rather then the current "one-off" approach 3. Explore alternative Variable Selection Mechanisms.
Conclusions - Not there yet.... - CT/RT Technology Promising - Need to condense various choices into data set(s) suitable for public consumption!