Download
1 / 36
360 likes | 379 Views
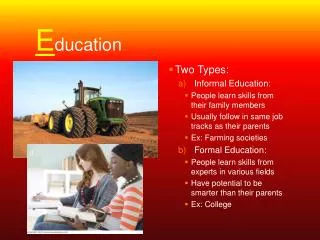
I U se S tatistics in E ducation. Luc Zwartjes Ghent University - geography department - luc.zwartjes@ugent.be. Many literacies. http://1.bp.blogspot.com/-4_JVJFugTgw/Ub_ME8TGkpI/AAAAAAAAeXg/Rm5qoUDqYBk/s1600/information+literacy.png. Language literacy Mathematics literacy

E N D
I UseStatisticsinEducation Luc Zwartjes Ghent University - geography department - luc.zwartjes@ugent.be
Many literacies http://1.bp.blogspot.com/-4_JVJFugTgw/Ub_ME8TGkpI/AAAAAAAAeXg/Rm5qoUDqYBk/s1600/information+literacy.png Language literacy Mathematics literacy Computer literacy Ocean literacy Science literacy Critical literacy Social literacy Relational literacy Sexual literacy Spatial literacy And more ... Future of Education conference Firenze, 12 June 2014 GI-Forum 2014, Salzburg
Literacyas stepstonetocitizenship http://www.teachingcitizenship.org.uk Education for citizenship equips young people with the knowledge, skills and understanding to play an effective role in public life encourages them to take an interest in topical and controversial issues and to engage in discussion and debate. learn to take part in decision-making and different forms of action. They evaluate information, make informed judgements and reflect on the consequences of their actions now and in the future. They learn to argue a case on behalf of others as well as themselves and speak out on issues of concern GI-Forum 2014, Salzburg
Statistics - everywhere • Everyactivityrelies on statistics – one way or the other • Today easy vividpresentations: figures, charts, living andinteractivediagramsandgraphs, • Useful tool in aiding research and studies in economics, socialsciences, business, medicine ...
Statistics - everywhere you are statistics!
Importanceandneedof statisticalliteracy Correct use... http://streetsmartproductmanager.com/tag/product-management/ GI-Forum 2014, Salzburg
Statisticscan prove ... Anything? http://www.fuelyourblogging.com/how-to-prove-anything-with-statistics/ GI-Forum 2014, Salzburg
... andhow is itvisualised? http://wiki.ead.pucv.cl/index.php/Archivo:02_ejemplo_cartografia_penademuerte_chernoff.jpg GI-Forum 2014, Salzburg
Importanceandneedof statisticalliteracy “to be an intelligent citizen it is necessary to know something about statistics”, research of Begg and Edwards (1999) and Chick and Pierce (2008). Solid background to the use and interpretation of statistics in education is very important, especially in the STEM subjects GI-Forum 2014, Salzburg
Importanceandneed of statisticalliteracy Statistics as a content domain is widely accepted typically taught as part of mathematics Used to show a result instead of doing real analysis and investigation. GI-Forum 2014, Salzburg
Mapping ‘Statistics’ across Europe: overall quantitative content analysis results
Population study of China in a typical 1980’s schoolbook (Diercke Erdkunde für Gymnasien in Nordrhein-Westfalen Industriestaaten und Entwicklungsländer 8, 1986)
Comparative study of the characteristics of the population in a typical 2010’s school workbook (Geogenie 4, editor De Boeck 2013).
Research statistics & education http://www.vadlo.com GI-Forum 2014, Salzburg
Little research statistical education: mainly methodological discipline - exists not for itself but rather to offer to other fields of study a coherent set of ideas and tools of dealing with quantitative information (Cobb and Moore, 1997). integration of statistics implies a basic quantitative literacy and the acquisition of a set of quantitative skills(Batanero and Díaz, 2010) GI-Forum 2014, Salzburg
Little research Teachers’ own statistical literacy determines quality Teachers share a variety of difficulties and misconceptions with their students about fundamental statistical ideas and representations (Batanero and Diaz, 2010) Teachers have difficulty in implementing an experimental approach or teaching through statistical investigations (Stohl, 2005). GI-Forum 2014, Salzburg
Fromteachers side ... feel students experience greater difficulties in statistics than other topics, consider themselves not well prepared to help their students face these difficulties. traditional beliefs and a static view of the way statistics can and should be used in class do not consider new forms of visualising statistical information as part of curriculum courses GI-Forum 2014, Salzburg
Fromstudents side ... not many opportunity to work with statistics / computer-based visualisations. many students not able to mean meaning from the data and information they are presented with. GI-Forum 2014, Salzburg
What is needed Promote statistical literacy and statistical reasoning by engaging teachers with real data and training, through project work, statistical investigations and problem-based learning (Arnold, 2008) Essential to work with ICTdata is not just a series of numbers, they are numbers with a context, having investigative cycles, interrogative cycles, and characteristic dispositions (Wild and Pfannkuch, 1999). GI-Forum 2014, Salzburg
What is needed Technological pedagogical content knowledge model (TPCK): teachers need - technology, - pedagogy- content knowledge skills (Koehler, 2008) GI-Forum 2014, Salzburg
What is needed GI-Forum 2014, Salzburg
The I-Use project a European funded project led by the geographydepartment of Ghent University (Belgium) partners from Belgium, Bulgaria, the CzechRepublic, Denmark, Greece, Sweden and the UK. outcomes: website, tools, teacher training course (TPCK) GI-Forum 2014, Salzburg
The I-Useproject: website (TPCK) GI-Forum 2014, Salzburg
The I-Use project: website (TPCK) GI-Forum 2014, Salzburg
The I-Use project: website (TPCK) GI-Forum 2014, Salzburg
The I-Use project: website (TPCK) GI-Forum 2014, Salzburg
The I-Use project: website (TPCK) GI-Forum 2014, Salzburg
The I-Use project: website (TPCK) DEMO GI-Forum 2014, Salzburg
The I-Use project: website (TPCK) GI-Forum 2014, Salzburg
The I-Use project: website (TPCK) DEMO GI-Forum 2014, Salzburg
The I-Use project: website (TPCK) GI-Forum 2014, Salzburg
The I-Use project: app (TPCK) I-UseappforAndroid: https://play.google.com/store/apps/details?id=iuse.com GI-Forum 2014, Salzburg
The I-Use project: pedagogy– (TPCK) GI-Forum 2014, Salzburg
The I-Use project: pedagogy(TPCK) introduction: role and value of statistical information, visualisation and its use 4 modules on statistical literacy and quantitative thinking, examples of the use of statistics in different curriculum areas explicit reference to responsible citizenship, online manual to help teachers to handle the materials and include them in curricula beyond the project. GI-Forum 2014, Salzburg
Next steps Erasmus + KA1 pilot course MytiliniSeptember 2014 Final course, open as KA1 course 7-10 September 2015Copenhagen, Denmark GI-Forum 2014, Salzburg
Want more info www.i-use.eu luc.zwartjes@ugent.be