Download
1 / 24
240 likes | 244 Views
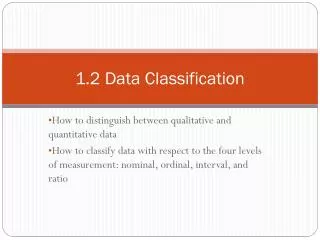
1.2 DATA TYPES. Outline. 1.0 Data types 2.0 Sources of data. 1. Data types. There are 3 types of data Cross sectional data Time series data Panel data. 1.1 Time series data. A time series is a set of observations on the values that a variable takes at different times

E N D
Outline 1.0 Data types 2.0 Sources of data
1. Data types • There are 3 types of data • Cross sectional data • Time series data • Panel data
1.1 Time series data • A time series is a set of observations on the values that a variable takes at different times • Such data may be collected at regular time intervals • Minutely and Hourly- collected literally continuously ( the so-called real time quote) • Daily- e.g., Financial time series-Stock prices, exchange rates; weather reports- rainfall, temperature • Weekly – e.g., money supply • Monthly- e.g., consumer price index • Quarterly- e.g., GDP • Semi-annually- e.g., Fiscal data • Annually- e.g., Fiscal data
1.2 Cross-sectional data • Cross-section data are data on one or more variables collected at the same point in time • Survey data- questionnaire is designed to capture all variables a research is looking for. • Macro data relating to different economic entities : countries, banks at a particular point in time. E.g. 2010 • Other data
1.3 Panel/pooled data • Panel data is a combination of both time and cross-section data • Specialized type is the longitudinal or micropanel data where a cross-sectional unit (say, individual, family, firm) is surveyed over time. • Surveying same individual over time is able to provide useful information on the dynamics of individual/household/firm behavior
2.0 SOURCES OF DATA • Data may be obtained from primary as well as secondary sources. • Primary sources - Primary data • information obtained firsthand by the researcher on the variables of interest for the specific purpose of the study • Secondary Sources- Secondary data • information gathered from existing sources
2.1 Secondary sources • This is data collected by someone other than the researcher conducting the study • Sources of secondary data include: • Books and periodicals • Government publications • Census data • etc
2.1.1 Common sources Secondary data • Data used in macroeconomic analysis may be collected by • Governmental agency • International agency • Private organizations • Individual
2.1.2 Governmental agencies • These are agencies established by governments to collect data. • These may include: Ministries, Central/Reserve banks, Statistical agencies.
2.1.3 International agencies • These are international institutions which provide credible data. E.g., • International Monetary Fund (IMF)- International Financial statistics, etc • World Bank (WB)- World development indicators, African development indicators • African Development Bank (ADB) Practical Exercise • Try to navigate the IMF , WB & ADB macro data
2.1.4 Private organizations • Some private institutions collect and construct some useful data sets used by economists. • Standard and poor, Moody, etc – provide information on country ratings. • Transparency International (TI)- provides data on corruption perceptions index (CPI) • Most of these institutions sell this data Exercise: Go to the TI website and try to access data on CPI.
2.1.5 Individuals • Some individuals conduct surveys, assemble the data in a particular format and sell it. • Others construct indices which they offer for sale or donate. • Chinn-Ito index- on financial liberalization
2.2 Primary sources • The main primary sources include: • Individuals • Focus groups • Panels
2.2.1 Individuals • Here information is obtained from individuals through: • interviews: - face-to-face, telephone, computer, electronic media. • administered questionnaires:- personally administered, mail, electronically administered. • Observation:- observe individuals and events without videotaping or audio recording
2.2.2 Focus groups • Focus groups may be of 8-10 persons with a moderator leading the discussions on a particular topic, concept, or product. • The role of the moderator is to introduce the topic, observe and take notes or tape the discussion. • Members of the group are chosen by virtue of their expertise or experience of the subject. • Focus group discussions are aimed at obtaining respondents’ impressions, interpretations, and opinions on the subject. • The nature of data obtained is qualitative .
2.2.3 Panels • Panels are like focus groups. • Difference- • Focus group- is a one-time session while panels meet more than once. • Panels are useful when a particular issue is being observed over time-political developments, economic developments • Panels may be static or dynamic. • Static- same members serve on the panel over extended periods of time. • Dynamic-members change from time to time as the various phases of the study are rolled out.

![[ 1.2 ] Types of Government](https://cdn4.slideserve.com/212900/1-2-types-of-government-dt.jpg)