Download
1 / 15
150 likes | 225 Views
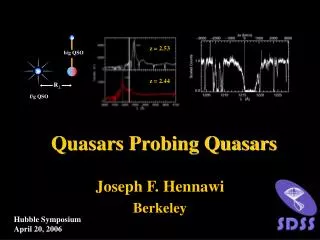
SDSS Quasars Spectra Fitting. N. Kuropatkin, C. Stoughton. Introduction Chris Stoughton.

E N D
SDSS Quasars Spectra Fitting N. Kuropatkin, C. Stoughton
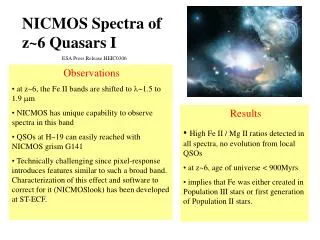
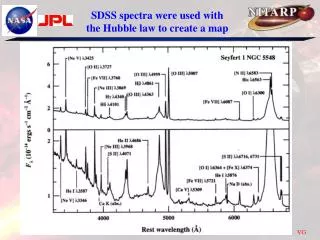
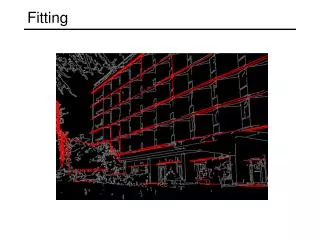
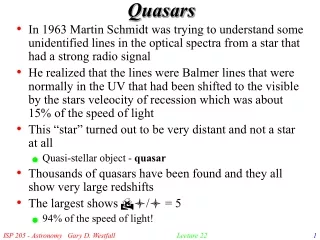
IntroductionChris Stoughton • Quasars are complex objects. A swirling cloud of gas and plasma falling into a black hole glows at many different wavelengths. Astronomers measure this spectrum of light to measure the properties of each quasar. The model we fit to the spectrum includes the following components:
power-law continuum, decreasing as exp(-lambda) • a Balmer Continuum due to ionized Hydrogen, with a characteristic bump from 2000 to 4000 Angstroms • strong emission lines from ionized gas, such as Hydrogen, Nitrogen, Oxygen, and Magnesium. • many faint emission lines from Iron • starlight from the galaxy that surrounds the quasar.
We vary the values of the parameters in this model to search for the parameters set that minimizes chi-squared. Since this includes hundreds of parameters, we used a "genetic" algorithm to find a good estimate of the parameters set with the best chi-squared. • The genetic algorithm keeps track of 100 sets of parameters. Borrowing terms from biology, we call one set of parameters a chromosome, and each parameter is a gene. We start by generating 100 random chromosomes, using reasonable ranges for the value of each gene. We calculate chi-squared for each chromosome and sort the results in order of increasing chi-squared. We then do 100 iterations of the following steps:
save the first chromosome (the "fittest" survives) • for the next 20 chromosomes, perturb the gene values by 1 sigma • for the next 20 chromosomes, perturb the gene values by 5 sigma • for the next 20 chromosomes, "breed" them by taking some genes from one parent and the rest of the genes from another parent • remove the remaining chromosomes and replace them with randomly generated ones • sort these "new" chromosomes in order of increasing chi-squared
At the end of these iterations, declare the first chromosome to be the estimate of the best chi-squared fit. • The Sloan Digital Sky Survey has measured the spectrum of tens of thousands of quasars. • Each spectral fit consumes approximately 1 hour of CPU time. • We are using the OSG to process these spectra with various implementations of this model.
Generic Grid GoferN. Kuropatkin • The task of fitting QSO spectra is an ideal job for the grid. • It is CPU bound. Execution time is about 1 hour. • Staged-in data and parameters are only about 1 Mbytes • Staged-out results are only about 2 Mbytes
Shown dataflow is very generic. • About 90% of all jobs on grid can satisfy the dataflow. • The main specific of different grid tools is the software used on the submission host. • We are using Generic Grid Gofer (GGG) – fine blend of SQL database and Grid Middleware in form of Java package. • Objectivities – simplicity, reliability, comprehensive bookkeeping, automatic production
GGG production steps • All jobs are stored in “jobs” table. • Available grid sites are stored in “pool” table • Job Manager takes jobs from the database, creates Condor DAG files and submits them to sites from the pool in an automatic mode. • Two main parts – Job Manager and DAG Creator • All completed stages of a job are recorded in the database together with submission time and execution time
The DAG Creator class • Implements interface between the Job Manager and Grid Middleware • Uses XML templates describing the job DAG and Condor submit files to create an abstract DAG and then a concrete DAG • Performs several stages of substitution of dummy parameters in the templates using values from environment, job description and site description files.
How any user can use the package to start his own production? • Install OSG software. • Install the GGG package • Use the Demo Application as a template to create your own production. You will need to modify 5 simple shell scripts and 5 simple XML files. • Create site description XML files for sites where you want to run your jobs. There is tool to help with this. • Distribute your software on those sites. See demo application how to do this • Initialize database. There are example programs • Lunch JobManager • Watch how it works.
Conclusion • We have created simple and generic tool to organize data processing on grid. This tool was used to process 10% of SDSS QSO spectra in about two weeks. The tool can be used for many different grid productions. • We are working on the software distribution and web page. • More details can be found at http://home.fnal.gov/~kuropat/sdss_grid/sdssprod.html