Download
1 / 37
370 likes | 516 Views
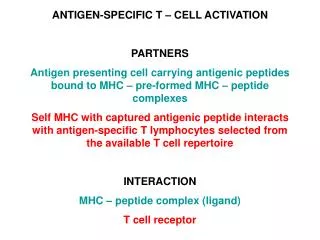
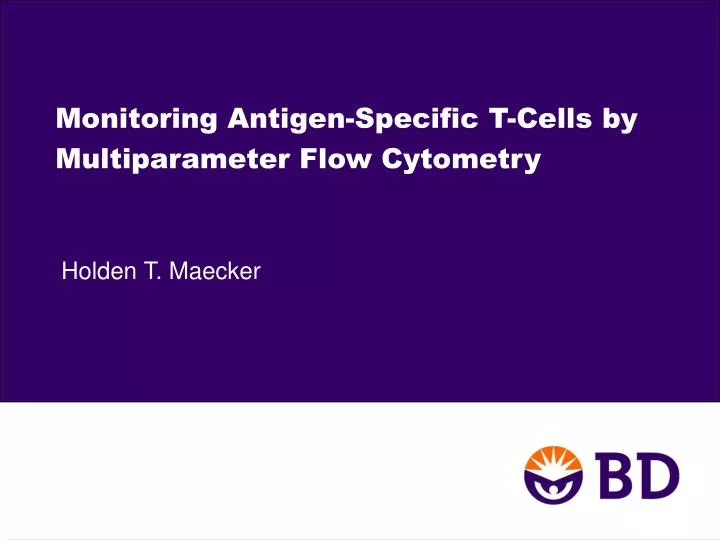
Monitoring Antigen-Specific T-Cells by Multiparameter Flow Cytometry. Holden T. Maecker. CMV as a model of a successful cellular immune response. Chronic, latent infection No pathology in immunocompetent hosts Usually no measurable viral titer in blood

E N D
Monitoring Antigen-Specific T-Cells by Multiparameter Flow Cytometry Holden T. Maecker
CMV as a model of a successful cellular immune response • Chronic, latent infection • No pathology in immunocompetent hosts • Usually no measurable viral titer in blood • Highly expanded populations of memory T cells
What can flow cytometry tell us about antigen-specific T cells? • T cell subsetting: • CD4, CD8 • Cytokine profiles: • IFNg, IL-2, TNFa, MIP-1b • Differentiation status: • CD27, CD28, CD45RA, CD45RO, CCR7, CD127, CD57 • Degranulation capacity: • CD107, perforin, granzyme B
Production of IL-2 and IFNg by antigen-specific T cells Naïve Antigen-Experienced IL-2- IFNg+ IL-2+ IFNg- IL-2+ IFNg+ Increasing cytotoxic potential Decreasing proliferative potential
Reported IL-2 defects in progressive HIV disease • Various authors: Lack of IL-2 production by HIV-specific CD4+ and/or CD8+ T cells • Sekaly et al.: HIV-specific CD4+ T cells lack ability to make IL-2 or proliferate in progressive disease • Pantaleo et al.: HIV-specific CD4+ T cells of progressors make IFNg but not IL-2, while non-progressors make IFNg and IL-2.
Simplified CD8+ T cell differentiation Naïve Antigen-Experienced CD45RA+ CD27- CD28- CD45RA+ CD27+ CD28+ CD45RA- CD27+ CD28+ “effector” Increasing cytotoxic potential Decreasing proliferative potential
Reported differentiation defects in progressive HIV disease • “Incomplete” effector differentiation of CD4+ or CD8+ T cells • Impaired cytolytic function of CD8+ T cells • Low perforin content in HIV-specific CD8+ T cells
Hypothesis • IL-2 drives the differentiation of effector T cells • Lack of IL-2 production by HIV-specific T cells results in impaired effector cell differentiation
HIV+ “progressors” and healthy controls • 19 HIV+ subjects with CD4 count decline to <500 cells/ml, persistent viremia >2000 copies/ml • 15 off therapy, 4 on therapy • All CMV+ • 20 healthy HIV- healthy subjects • All CMV+
All events CD3+ gate B CD8 APC-Cy7 Side Light Scatter C A CD3 Pacific Blue CD4 AmCyan CD4+ CD8- gate CD4- CD8+ gate IFNg FITC IFNg FITC IL-2 PE IL-2 PE CD8+ IFNg+ CD4+ IFNg+ CD8+ IFNg+ IL-2+ CD4+ IFNg+ IL-2+ Side Light Scatter Side Light Scatter Side Light Scatter Side Light Scatter CD27 APC CD27 APC CD27 APC CD27 APC CD45RA PE-Cy7 CD45RA PE-Cy7 CD45RA PE-Cy7 CD45RA PE-Cy7 CD45RA PE-Cy7 CD45RA PE-Cy7 CD45RA PE-Cy7 CD45RA PE-Cy7 CD28 PerCP-Cy5.5 CD28 PerCP-Cy5.5 CD28 PerCP-Cy5.5 CD28 PerCP-Cy5.5 CD28 PerCP-Cy5.5 CD28 PerCP-Cy5.5 CD28 PerCP-Cy5.5 CD28 PerCP-Cy5.5
Assay standardization for clinical trials • Target channels for PMT voltages using mid-range calibration particles • Pre-configured lyophilized reagent plates • Stimulation • Staining • Gating • Centralized analysis (single template) • Dynamic gates
FCS files Batch analysis with dynamic gating Transfer of data Statistics files Custom Excel spread- sheet Web database
Stability of phenotypic markers A. B. 0 h stimulation 6 h stimulation 1.8% 1.8% CMV tetramer PE CMV tetramer PE IFNg FITC IFNg FITC 66% 34% 66% 34% Side Light Scatter Side Light Scatter CD27 APC CD27 APC 90% 1.7% 92% 2.3% 75% 5.0% 65% 6.3% CD45RA PE-Cy7 CD45RA PE-Cy7 CD45RA PE-Cy7 CD45RA PE-Cy7 8.3% 0.2% 5.7% 0.2% 20% 8.9% 14% 5.3% CD28 PerCP-Cy5.5 CD28 PerCP-Cy5.5 CD28 PerCP-Cy5.5 CD28 PerCP-Cy5.5
Results: CMV response • IL-2 production • Differentiation status
105 104 103 102 101 0 IFNg+ IFNg+ IL-2+ A small fraction of IFNg+ cells make IL-2 CD4+ IFNg+ CD8+ IFNg+ 105 104 103 CD8+ IL-2+ cells/ml CD8+ IL-2+ cells/ml 102 101 0 IFNg+ IFNg+ IL-2+ HIV- subjects pp65+IE-1 response
CMV responses are effector-dominated CD4+ IFNg+ CD8+ IFNg+ 4000 HIV- subjects pp65+IE-1 response 2000 Cytokine+ cells/ml blood 0 CD27: + + - - + + - - + + - - + + - - CD28: + + + + - - - - + + + + - - - - CD45RA: + - - + - + - + + - - + - + - +
CD8+ IFNg+ CD45RA+ CD27- CD28- 15000 10000 Absolute # of stimulated IFNg+ cells/ml 5000 0 0 5000 10000 15000 20000 Absolute # of unstimulated cytokine+ cells/ml 2 = 0.3192 r p < 0.0001 Terminal Effector Cell ResponseCorrelates with Spontaneous IFNg
HIV- subjects pp65+IE-1 response 0.3 0.2 Ratio of IL-2+ to IFNg+ cells 0.1 0.0 CD27: + - - + + - - CD28: + + + - - - - CD45RA: - - + - + - + IL-2 production is correlated with phenotype
Results: HIV response • IL-2 production • Differentiation status
HIV responses lack CD8+ IL-2+ cells Ratio IL-2+/IFNg+ cells: Absolute counts of IL-2+ cells: 0.0005 105 0.0005 0.5 104 0.4 103 0.3 Ratio of IL-2+ to IFNg+ cells CD8+ IFNg+ IL-2+ cells/ml 102 0.2 101 0.1 0 0.0 HIV- pp65+IE-1 HIV+ pp65+IE-1 HIV+ gag+env HIV- pp65+IE-1 HIV+ pp65+IE-1 HIV+ gag+env
CD4+ IFNg+ CD8+ IFNg+ HIV- subjects pp65+IE-1 HIV+ subjects pp65+IE-1 Cytokine+ cells/ml blood HIV+ subjects gag+env CD27: + + - - + + - - + + - - + + - - CD28: + + + + - - - - + + + + - - - - CD45RA: + - - + - + - + + - - + - + - +
CD8+ CD4+ 400 300 HIV+ subjects all CD4+ or CD8+ cells Cells/ml blood 200 100 0 CD27: + + - - + + - - + + - - + + - - CD28: + + + + - - - - + + + + - - - - CD45RA: + - - + - + - + + - - + - + - + Phenotypes of total CD4+ and CD8+ T cell pools
Relationship of IL-2 and differentiation • Two major differences between CMV and HIV responses: • Ability of CD8+ T cells to make IL-2 • Differentiation state of CD8+ (and CD4+) T cells • Are these two “defects” related? • IL-2 producing CD8+ T cell phenotypes might be lost in HIV responses • IL-2 might drive differentiation of effector CD8+ T cells
Reduced IL-2 from all phenotypes of HIV-specific CD8+ T cells 0.3 HIV- subjects pp65+IE-1 0.2 0.1 0.0 0.3 HIV+ subjects pp65+IE-1 0.2 Ratio of IL-2+ to IFNg+ cells 0.1 0.0 0.3 HIV+ subjects gag+env 0.2 0.1 0.0 CD27: + - - + + - - CD28: + + + - - - - CD45RA: - - + - + - +
Gag+Env Gag+Env 10000 10000 p=0.0006 p=0.0004 2 r =0.5126 2 r =0.5255 1000 1000 100 100 Total IL-2+ cells/ml CD8+ IL-2+ cells/ml 10 10 1 1 10 100 1000 10000 100000 10 100 1000 10000 100000 CD8+ IFNg+ CD27- CD28- CD45RA+ cells/ml CD8+ IFNg+ CD27- CD28- CD45RA+ cells/ml Correlation of IL-2 production and presence of effector cells (HIV) CD8+ T cells only All T cells
Correlation of CD8+ IL-2 production and presence of effector cells (CMV)
Both stimulations Both stimulations 10000 10000 p=0.0034 p=0.0073 2 r =0.2090 2 r =0.1786 1000 1000 100 100 CD8+ IL-2+ cells/ml Total IL-2+ cells/ml 10 10 1 1 10 100 1000 10000 100000 10 100 1000 10000 100000 CD8+ IFNg+ CD27- CD28- CD45RA+ cells/ml CD8+ IFNg+ CD27- CD28- CD45RA+ cells/ml Correlation of CD8+ IL-2 production and presence of effector cells CD8+ T cells only All T cells
Addition of IL-2 can increase the proportion of effector cells during in vitro culture (CMV)
Model of IL-2 effect on differentiation Naïve Antigen-Experienced CD45RA+ CD27- CD28- CD45RA+ CD27+ CD28+ CD45RA- CD27+ CD28- CD45RA- CD27+ CD28+ CMV: IL-2+ + +++++++++++ HIV: IL-2- +++++++++++ ++
Additional questions • Can IL-2 therapy in vivo alter the differentiation state of antigen-specific T cells? • To what extent do other cytokines contribute to effector T cell differentiation in vivo?
34% Other factors that may lead to differentiation changes in HIV • Availability of IL-7, IL-15 or other T cell survival factors • Expression of CD70 (CD27L) on HIV-infected T cells • Production of IFNa by dendritic cells: CpG-stimulated Gated on Lineage-negative, HLA-DR-bright leukocytes CD123 PerCP-Cy5.5 Anti-IFNa PE
Summary • There are significantly more CD8+ IL-2+ cells responding to CMV compared to HIV. • CD8+ CMV responses are dominated by effector cells (CD27-CD28-CD45RA+), while CD8+ HIV responses are dominated by cells of intermediate differentiation (CD27+CD28-CD45RA-). • IL-2 production is mostly from non-effector cells (CD28+). • The proportion of CD8+ IL-2+ cells is correlated with the presence of CD8+ effector cells. • IL-2 may drive effector cell differentiation in vitro.
Implications • Lack of IL-2 production by CD8+ T cells responding to HIV likely results in incomplete effector cell generation. • Immune monitoring of HIV should include determination of HIV-specific CD8+ IL-2+ T cells.
4-color CD4/CD8/IFNg/IL-2 staining 0.1 1.3 0.7 1.6 12.3 3.8
Acknowledgements • Laurel Nomura • Smita Ghanekar • Maria Jaimes • Eugene Veteska • Perry Haaland • Brinda Emu • Rebecca Hoh • Steve Deeks • Jeff Martin • Mike McCune • Doug Nixon