Download
1 / 8

E N D
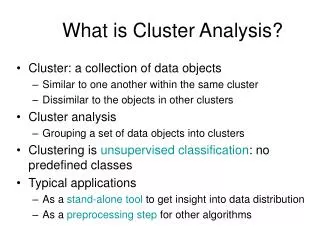
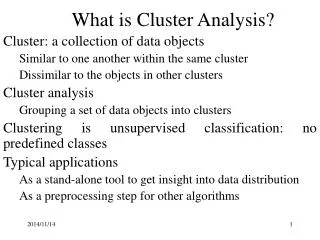
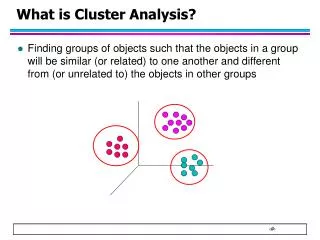
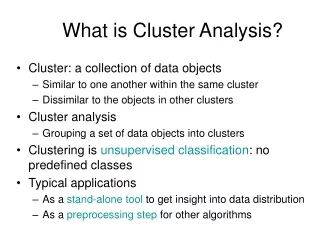
What is cluster analysis? Cluster analysis is a statistical method for processing data. It works by organizing items into groups – or clusters – based on how closely associated they are.it is a powerful data mining tool used for processing data,it makes work easier by organizing items into groups or clusters based on how closely associated they are. The objective of cluster analysis is to find similar groups of subjects,where the similarity exist between each pair of subjects,it represents a unique characteristic of the group versus the sample. A single cluster indicates an extremely heterogenous data. Cluster analysis is an unsupervised learning algorithm, meaning that you don’t know how many clusters exist in the data before running the model. Unlike many other statistical methods, cluster analysis is typically used when there is no assumption made about the likely relationships within the data. It provides information about where associations and patterns in data exist, but not what those might be or what they mean. When should cluster analysis be used ? Cluster analysis is when you’re looking to segment or categorize a dataset into groups based on similarities, but aren’t sure what those groups should be. It may be tempting to use cluster analysis in many different research projects but it’s important to know when it’s genuinely the right fit. Here are three of the most common scenarios where cluster analysis proves its worth. Exploratory data analysis When you have a new dataset and are in the early stages of understanding it, cluster analysis can provide a much-needed guide. By forming clusters, you can get a read on potential patterns or trends that could warrant deeper investigation.
Market segmentation This is a golden application for cluster analysis, especially in the business world. Because when you aim to target your products or services more effectively, understanding your customer base becomes paramount. Cluster analysis can carve out specific customer segments based on buying habits, preferences or demographics, allowing for tailored marketing strategies that resonate more deeply. Resource allocation Be it in healthcare, manufacturing, logistics or many other sectors, resource allocation is often one of the biggest challenges. Cluster analysis can be used to identify which groups or areas require the most attention or resources, enabling more efficient and targeted deployment. How is cluster analysis used? The most common use of cluster analysis is classification. Subjects are separated into groups so that each subject is more similar to other subjects in its group than to subjects outside the group. In a market research context, cluster analysis might be used to identify categories like age groups, earnings brackets, urban, rural or suburban location. In marketing, cluster analysis can be used for audience segmentation, so that different customer groups can be targeted with the most relevant messages. Healthcare researchers might use cluster analysis to find out whether different geographical areas are linked with high or low levels of certain illnesses, so they can investigate possible local factors contributing to health problems. Employers, on the other hand, could use cluster analysis to identify groups of employees who have similar feelings about workplace culture, job satisfaction or career development. With this data, HR departments can tailor their initiatives to better suit the needs of specific clusters, like offering targeted training programs or improving office amenities. Whatever the application, data cleaning is an essential preparatory step for successful cluster analysis. Clustering works at a data-set level where every point is assessed relative to the others, so the data must be as complete as possible.
Cluster analysis in action: A step-by- step typical example Here’s how an online bookstore called talemongers used cluster analysis to transform its raw data into actionable insights. Step one: The objective The bookstore’s aim is to provide more personalized book recommendations to its customers. The belief is that by curating book selections that will be more appealing to subgroups of its customers, the bookstore will see an increase in sales. Step two: Using the right data Talemongers has its own historical sales data, including two key variables: ‘favorite genre’, which includes categories like sci-fi, romance and mystery; and ‘average spend per visit’. The bookstore opts to hone in on these two factors as they are likely to provide the most actionable insights for personalized marketing strategies. Step three: Choosing the best approach After settling on the variables, the next decision is determining the right analytical approach. The bookstore opts for K-means clustering for the ‘average spend per visit’ variable because it’s numerical –and therefore scalar data. For ‘favorite genre’, which is categorical – and therefore non-scalar data – they choose K-medoids. Step four: Running the algorithm With everything set, it’s time to crunch the numbers. The bookstore runs the K-means and K- medoids clustering algorithms to identify clusters within their customer base. The aim is to create three distinct clusters, each encapsulating a specific customer profile based on their genre preferences and spending habits.
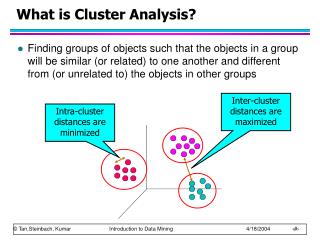
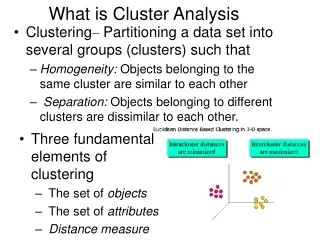
Step five: Validating the clusters Once the algorithms have done their work, it’s important to check the quality of the clusters. For this, the bookstore looks at intracluster and intercluster distances. A low intracluster distance means customers within the same group are similar, while a high intercluster distance ensures the groups are distinct from each other. In other words, the customers within each group are similar to one another and the group of customers are distinct from one another. Step six: Interpreting the results Now that the clusters are validated, it’s time to dig into what they actually mean. Each cluster should represent a specific customer profile based solely on ‘favorite genre’ and ‘average spend per visit’. For example, one cluster might consist of customers who are keen on sci-fi and tend to spend less than #2000, while another cluster could be those who prefer romance novels and are in the #2000-4000spending range. Step seven: Applying the findings The final step is all about action. Armed with this new understanding of their customer base, the bookstore can now tailor its marketing strategies. Knowing what specific subgroups like to read and how much they’re willing to spend, the store can send out personalized book recommendations or offer special discounts to those specific clusters – aiming to increase sales and customer satisfaction. Cluster analysis algorithms The choice of cluster analysis algorithm is important, particularly when you have mixed data. In major statistics packages you’ll find a range of preset algorithms ready to number-crunch your matrices. K-means and K-medoid are two of the most suitable clustering methods. In both cases (K) = the number of clusters.
K-means The K-means algorithm establishes the presence of clusters by finding their centroid points. A centroid point is the average of all the data points in the cluster. By iteratively assessing the Euclidean distance between each point in the dataset, each one can be assigned to a cluster. The centroid points are random to begin with and will change each time as the process is carried out. K-means is commonly used in cluster analysis, but it has a limitation in being mainly useful for scalar data. K-medoids K-medoid works in a similar way to K-means, but rather than using mean centroid points which don’t equate to any real points from the dataset, it establishes medoids, which are real interpretable data-points. The K-medoids clustering algorithm offers an advantage for survey data analysis as it is suitable for both categorical and scalar data. This is because rather than measuring Euclidean distance between the medoid point and its neighbors, the algorithm can measure distance in multiple dimensions, representing a number of different categories or variables. K-medoids is less common than K-means in clustering analysis, but is often used when a more robust method that’s less sensitive to outliers is needed. WHAT IS A/B TESTING? What is A/B testing? A/B testing (also known as split testing or bucket testing) is a methodology for comparing two versions of a webpage or app against each other to determine which one performs better. A/B testing is essentially an experiment where two or more variants of a page are shown to users at random, and statistical analysis is used to determine which variation performs better for a given conversion goal.
Running an A/B test that directly compares a variation against a current experience lets you ask focused questions about changes to your website or app and then collect data about the impact of that change. Testing takes the guesswork out of website optimization and enables data-informed decisions that shift business conversations from "we think" to "we know." By measuring the impact that changes have on your metrics, you can ensure that every change produces positive results. As visitors are served either the control or variation, their engagement with each experience is measured and collected in a dashboard and analyzed through a statistical engine. You can then determine whether changing the experience (variation or B) had a positive, negative or neutral effect against the baseline (control or A). Why you should A/B test A/B testing allows individuals, teams and companies to make careful changes to their user experiences while collecting data on the impact it makes. This allows them to construct hypotheses and to learn what elements and optimizations of their experiences impact user behavior the most. In another way, they can be proven wrong—their opinion about the best experience for a given goal can be proven wrong through an A/B test. More than just answering a one-off question or settling a disagreement, A/B testing can be used to continually improve a given experience or improve a single goal like conversion rate optimization (CRO) over time. A B2B technology company may want to improve their sales lead quality and volume from campaign landing pages. In order to achieve that goal, the team would try A/B testing changes to the headline, subject line, form fields, call-to-action and overall layout of the page to optimize for reduced bounce rate, increased conversions and leads and improved click-through rate. Testing one change at a time helps them pinpoint which changes had an effect on visitor behavior, and which ones did not. Over time, they can combine the effect of multiple winning changes from experiments to demonstrate the measurable improvement of a new experience over the old one. This method of introducing changes to a user experience also allows the experience to be optimized for a desired outcome and can make crucial steps in a marketing campaign more effective. By testing ad copy, marketers can learn which versions attract more clicks. By testing the subsequent landing page, they can learn which layout converts visitors to customers best. The overall spend on a marketing campaign can actually be decreased if the elements of each step work as efficiently as possible to acquire new customers. A/B testing process The following is an A/B testing framework you can use to start running tests:
Collect data: Your analytics tool (for example Google Analytics) will often provide insight into where you can begin optimizing. It helps to begin with high traffic areas of your site or app to allow you to gather data faster. For conversion rate optimization, make sure to look for pages with high bounce or drop-off rates that can be improved. Also consult other sources like heatmaps, social media and surveys to find new areas for improvement. Identify goals: Your conversion goals are the metrics that you are using to determine whether or not the variation is more successful than the original version. Goals can be anything from clicking a button or link to product purchases. Generate test hypothesis: Once you've identified a goal you can begin generating A/B testing ideas and test hypotheses for why you think they will be better than the current version. Once you have a list of ideas, prioritize them in terms of expected impact and difficulty of implementation. Create different variations: Using your A/B testing software (like Optimizely Experiment), make the desired changes to an element of your website or mobile app. This might be changing the color of a button, swapping the order of elements on the page template, hiding navigation elements, or something entirely custom. Many leading A/B testing tools have a visual editor that will make these changes easy. Make sure to test run your experiment to make sure the different versions as expected. Run experiment: Kick off your experiment and wait for visitors to participate! At this point, visitors to your site or app will be randomly assigned to either the control or variation of your experience. Their interaction with each experience is measured, counted and compared against the baseline to determine how each performs. Wait for the test results: Depending on how big your sample size (the target audience) is, it can take a while to achieve a satisfactory result. Good experiment results will tell you when the results are statistically significant and trustworthy. Otherwise it would be hard to tell if your change truly made an impact. Analyze results: Once your experiment is complete, it's time to analyze the results. Your A/B testing software will present the data from the experiment and show you the difference between how the two versions of your page performed and whether there is a statistically significant difference. It is important to achieve statistically significant results so you’re confident in the outcome of the test. If your variation is a winner, congratulations ?! See if you can apply learnings from the experiment on other pages of your site and continue iterating on the experiment to improve your results. If your experiment generates a negative result or no result, don't worry. Use the experiment as a learning experience and generate new hypothesis that you can test. A travel company may want to increase the number of successful bookings are completed on their website or mobile app, or may want to increase revenue from ancillary purchases. To improve these metrics, they may test variations of: Homepage search modals Search results page Ancillary product presentation
A/B Testing Examples An e-commerce company might want to improve their customer experience, resulting in an increase in the number of completed checkouts, the average order value, or increase holiday sales. To accomplish this, they may A/B test: Homepage promotions Navigation elements Checkout funnel components A technology company might want to increase the number of high-quality leads for their sales team, increase the number of free trial users, or attract a specific type of buyer. They might test: Lead form fields Free trial signup flow Homepage messaging and call-to-action These A/B testing case studies show the types of results the world's most innovative companies have seen through A/B testing with Optimizely's solution Experiment