Download

1 / 100
1k likes | 1k Views
Plan for a course on decision analysis with small problem sets, using a motivating pirate example. Explore the value of information (VOI) and decision-making in imperfect information scenarios.

E N D
Plan for course Small problem sets along the way.
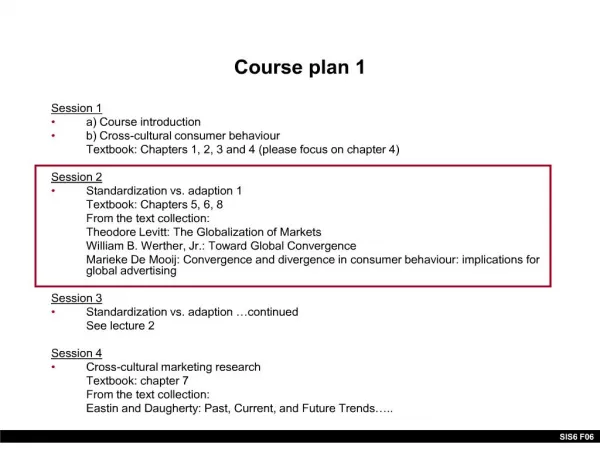
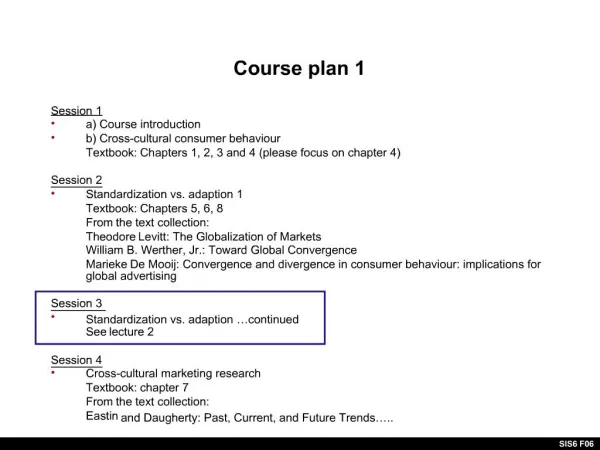
Treasure (0.16) Treasure (0.0005) Dig Dig No treasure (0.9995) No treasure (0.84) Don’t dig Don’t dig PoV - imperfect information $100 K $7.71 K $7.71 K “Positive” (0.06) - $10 K $0 K $100 K $0.46 K - $9.95 K “Negative” (0.94) - $10 K $0 K $0 K
What if several projects / treasures? C A P Where to invest? All or none? Free to choose as many as profitable? One at a time, then choose again? Where should one collect data? All or none? One only? Or two? One first, then maybe another? B
Dependence? Does it matter? Gray nodes are petroleum reservoir segments wherethecompanyaims to develop profitable amountsofoil and gas. Drill theexplorationwell at this segment! The valueofinformation is largest.
VOI and Earth sciences • Alternatives are spatial, often with high flexibiliy in selection of sites, control rates, intervention, excavation opportunities, harvesting, etc. • Uncertainties are spatial, with multi-variable interactions . Often both discrete and continuous. • Value function is spatial, typically involving coupled features, say through differential equations. It can be defined by «physics» as well as economic attributes. • Data are spatial. There are plenty opportunities for partial, total testing and a variety of tests (surveys, monitoring sensors, electromagnetic data, , etc.)
Geostatistics (Kriging) Is mining profitable? What is thevalueofthisadditionalinformation?
Joint pdfs There are families of joint pdfs. Parametrically, or non-parametrically. Gaussian distribution is very common: For a Gaussian process, in a spatial application, the covariance entries are formed in a particular way.
Example - Gaussian process Design matrix:
Gaussian process - model Goal is:
Norwegian wood - forestry example . Farmer must decide whether to harvest forest, or not. There is uncertainty about timber volumes and profits over the spatial domain. Another decision is whether to collect data before making these decisions. If so, how and where should data be gathered. Where to put survey lines for timbervolumesinformation? Typicallypartial, imperfectinformation.
Norwegian wood - posterior Design matrix: Goal is: This is Kriging prediction and associated variance.
Norwegian wood – information • Wecan base data gatheringschemeson different criteria • Maximum variancereduction • Maximum entropy • Value ofinformation (VOI) VOI is based on decision situation! Others are not material – not tied to decision situation.
Spatial design • Geometriccriterion(space-filling design). • Minimizeaveragedistancebetween data locations. • Set a thresholdon minimum distance to nearest data location. • Challenging to comparevarious data accuracies. • Variancereductioncriterion. • Kriging-relatedcriteria (slope and weightofmean). • Entropyreductioncriterion. • Predictionerror.
Variance reduction Expected variance reduction: Could use a weighted sum, or choose a subset of variables for prediction.
Variance reduction (Kriging) Overall variance reduction is larger for the random design.
Entropy (Shannon) Expected mutual information:
Entropy of a Gaussian Very commonly used in the design of spatial experiments (air quality monitoring, river monitoring networks, etc.)
Entropy of a Gaussian Problem: Compute the entropy of a bivariate standard Gaussian (with no correlation). Adjust the correlation so that a Gaussian bivariate model with variance equal to 1.5 gets the same entropy as the standard Gaussian in 1.
Entropy blind-spot 2 3 1 4 n This criterion always looks for marginals with largest entropy! For a single observation, entropy would select node 1!
VOI - Pyramid of conditions ECONOMIC Pyramid of conditions - VOI is different from other information criteria (entropy, variance, prediction error, etc.)
Formula for VOI Spatial alternatives. Spatial uncertainties. Spatial value function. Spatial data.
Decoupling – values are sums . Profit is sum of timber volumes from units.
Low versus high decision flexibility . High flexibility: Farmer canselectindividualforest units. Lowflexibility: Farmer must select all forest units, or none.
Decoupled versus coupled value . Farmer must decide whether to harvest at forest units, or not. Value decouples to sum over units. Petroleum company must decide how to produce a reservoir. Value involvescomplexcouplingof drilling strategies, and reservoirproperties.
Computation - Formula for VOI • Computations : • Easierwithlowdecisionflexibility ( less alternatives). • Easierifvaluedecouples(sums or integrals split). • Easier for perfect, total, information(upperboundon VOI). • Sometimesanalyticalsolutions. Otherwiseapproximations and Monte Carlo.
Formula for total perfect information Upper bound on any information gathering scheme.
VOI – Gaussian models Lowflexibility: Must select all units, or none. Value decouples to sum. standard Gaussian density and cumulative function
Results - Forestry example . Lowflexibility: Must select all units, or none. Total: all cells. Partial: Every cell along center lines. Aggregated partial: sums along center lines. (Results are normalized for area).
Norwegian wood - Insight in VOI . • Total test does not necessarily give much higher VOI than a partial test. It depends on the spatial design of experiment as well as the prior model (mean and dependence). • VOI increases with larger dependence in spatial uncertainties. • VOI is largest when we are most indifferent in prior (mean near 0 and large prior uncertainty. • VOI increases with higher accuracy of measurements.
Implementation : Norwegian wood • Consider profits, modeled as a Gaussian random field represented on a 25 x 25 grid for the 625 units. The mean is m=0 at all cells, the covariance is exponential with st dev r=1 and correlation range r=40. Draw a random realization of this Gaussian process. • One can gather imperfect data at 100 random design locations, giving unbiased profit measurements, and independent error withst dev 0.5. Draw a random dataset. • Compute the Kriging prediction and the associated variances. • Compute the VOI (using the same data design) of the decision situation where the farmer harvest all units or none. • Compare the VOI results (using the same data design) for different prior mean, variances, correlation ranges and measurement noise terms. Problem:
I love rock and ore – mining example Is mining profitable? What is thevalueofthisadditionalinformation?
VOI workflow • Low decision flexibility. De-coupled value function. • Gather information by XRF or XMET in boreholes. No opportunities for adaptive testing. • Model is a spatial Gaussian process. • VOI analysis done by exact, Gaussian, computations.
Decision situation and data Planned boreholes. Mining blocks. Some waste rock. Some high-grade.
Information gathering Planned boreholes. • Total test : 265 measurements in 21 new boreholes. • Partial test: Drilling and sampling data only in a subset of boreholes. • Perfect testing (XRF: done in lab). Imperfect testing (XMET: handheld meter).
Prior and likelihood model Set from current data. Defined by test (XRF, XMET). Defined by design of boreholes. -XRF data -XMET data
VOI Weights set from block model(waste or ore). Analytical solution under the Gaussian modeling assumptions.
I love rock and ore - Take home: . • Information connected to partialperfect testing can be less/more than total imperfect testing. • Information criteriadependon design and data accuracy. • Entropyappears to like perfectinformation. • VOI can be connectedwithdecisions and prices (not so easy for othercriteria).
Computation - Formula for VOI Main challenge. • Computations : • Easierwithlowdecisionflexibility ( less alternatives). • Easierifvaluedecouples(sums or integrals split). • Easier for perfect, total, information(upperboundon VOI). • Sometimesanalyticalsolutions, otherwiseapproximations and Monte Carlo.
Techniques – Computing the VOI Outer integral. Inner integral. • Techniques : • Fullyanalyticallytractable for two-action, linear Gaussianmodels. • Analytical or partlyanalytical for Markovianmodels, graphs. • (Monte Carlo sample over data, analytical for innerexpectation.) • Variousapproximations and Monte Carlo usuallyapplicable. • Shouldavoid double Monte Carlo (inner and outer). Too time consuming.