Download
1 / 22
250 likes | 652 Views
T. Income Distribution. Overview. Introduction Wages and Salaries Income Inequality Interest Income, Savings, Rental Income & profit Circular Flow & Gross Domestic Product Causes of Income Inequality Government Programs to Reduce Poverty Who Is Poor? Regional Income Inequality .

E N D
T Income Distribution
Overview • Introduction • Wages and Salaries • Income Inequality • Interest Income, Savings, Rental Income & profit • Circular Flow & Gross Domestic Product • Causes of Income Inequality • Government Programs to Reduce Poverty • Who Is Poor? • Regional Income Inequality
Income Distribution • Three basic economic questions are: 1. What to produce? 2. How to produce it? 3. For whom to produce it for? • Supply and demand will answer these questions in the productive resources market in the form of wages, rent, interest and profit.
Wages & Salaries • Increases in demand and decreases in supply cause wages to be higher BUT……… • Decreases in demand and increases in supply cause wages to be lower
Increase in demand for plumbers 30 25 Wages per hour ($) 20 D2 Shortage 10 100 200 300 400 500 600 Number of Plumbers (fig.8.2/8.3) p. 160
Decrease in demand for plumbers 30 Surplus 25 Wages per hour ($) 20 15 10 D2 100 200 300 400 500 600 Numberof Plumbers
Decrease in supplyof plumbers S2 30 25 Wages per hour ($) 20 15 Shortage 10 200 300 400 500 600 100 Number of Plumbers
Increase in supply of plumbers S2 30 Surplus 25 Wages per hour ($) 20 15 10 100 200 300 400 500 600 NumberofPlumbers
Factors Affecting Wages & Salaries • Government regulations • minimum wage and fringe benefits • Labour unions • Large employers • Mobility of workers • Barriers to entry • specialized training, discrimination
Financial Distribution of a business or individual Interest Income: Price paid to a lender for the use of a sum of money over a period of time Savings: Part of income that is not spent on goods and services Rental Income: Payment for the use of a resource, specifically land
Income from Profits • What is left over after all the costs have been paid for from the revenue earned by a business or an individual (i.e. Total Revenue – Total Costs) • Reward to the entrepreneur for taking the risk of starting a business • Prime motivator to start a business and run it well to satisfy the wants and needs of consumers
Circular Flow • Figure 8.5 p. 167
Gross Domestic Product • Also known as GDP • The total value at market prices of all final goods and services produced in Canada over a period of time (usually a year)
Ways to Calculate GDP • Expenditure approach: = Consumption + Investment + Government + (Exports – Imports)or C + I + G + (X - M) • Income approach: = Wages + Rent + Interest + Profit – (depreciation + taxes)
Who is Poor? • Statistics Canada Low Income Cut-Off (L.I.C.O.) includes those who spend 70% or more on the three life essentials (food, clothing, shelter) • 12% of families and 30% of unattached individuals live below the L.I.C.O. line
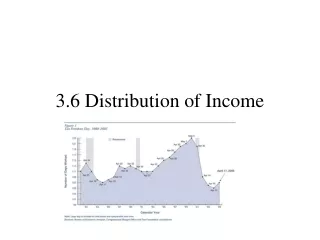
Income Inequality • Lorenz Curve is a graph that helps illustrate the income inequality in a society by contrasting perfect equality with reality within a given economy
Natural ability Education, training and opportunity Property ownership Ability to influence wages and salaries labour unions and professional associations Discrimination – women and minorities Poor health or physical disability Region or residence Ontario higher incomes than Newfoundland Luck lottery, accident Weeks worked Age Causes of Income Inequality
Government Programs to Reduce Poverty • Investment in human capital (i.e. education and skill training) • Keep economy operating at a high level to provide jobs • Safety programs to protect workers and universal health care • Old age security pension, unemployment insurance, welfare, Canada Assistance Plan (C.A.P.) Example: WHMIS
Regional Income Inequality • Saskatchewan, Alberta and British Columbia are wealthier • Why? • Maritimes and Quebec poorer • Why?
Debate • Each person will draw a role out of a hat • The class will then be divided into 2 groups • In groups, you will be given 5 minutes to brainstorm your position on poverty • The debate will then commence
Positions on Poverty • Position A: Poverty is the result of personal inadequacies. The poor are responsible for their own condition. Some are poor because they like it that way – bums and hobos have chosen poverty as a way of life and have decided not to work. Poor people whoa re middle-aged or elderly started with the same opportunities as everyone else. They could have worked hard to increase their skills and their incomes, but instead they frittered away their lives. Why then should society support them or be concerned about them? • Position B: Poverty is the result of social forces beyond the control of the individual. These forces include racial, religious, and gender-related prejudices; regional disparity; unequal opportunities for education and the learning of employable skills; and rapid technological change that has made some skills redundant. Other people are poor because disease or accident has left them unable to work. The poor are not responsible for their own condition – they are victims. Society should therefore be responsible for them.
Did you know?… • Over 3 billion people live on less than $2 per day. That’s half of the world’s population.