Download

1 / 21
670 likes | 1.63k Views
PARETO ANALYSIS. Başak Karakaya Industrial Engineering Department. Pareto analysis is a formal technique useful where many possible courses of action are competing for attention.

E N D
PARETO ANALYSIS Başak Karakaya Industrial Engineering Department
Pareto analysis is a formal technique useful where many possible courses of action are competing for attention.
Pareto analysis is a creative way of looking at causes of problems because it helps stimulate thinking and organize thoughts.
This technique helps to identify the top 20% of causes that needs to be addressed to resolve the 80% of the problems.
The value of the Pareto Principle for a project manager is that it reminds you to focus on the 20% of things that matter. Of the things you do during your project, only 20% are really important. Those 20% produce 80% of your results. Identify and focus on those things first, but don't totally ignore the remaining 80% of causes.
History of Pareto Analysis • The Pareto effect is named after Vilfredo Pareto, an economist and sociologist who lived from 1848 to 1923.
This method stems in the first place from Pareto’s suggestion of a curve of the distribution of wealth in a book of 1896. Whatever the source, the phrase of ‘the vital few and the trivial many’ deserves a place in every manager’s thinking. It is itself one of the most vital concepts in modern management. The results of thinking along Pareto lines are immense.
Step 1: Identify and List Problems • Step 2: Identify the Root Cause of Each Problem • Step 3: Score Problems • Step 4: Group Problems Together By Root Cause • Step 5: Add up the Scores for Each Group • Step 6: Take Action
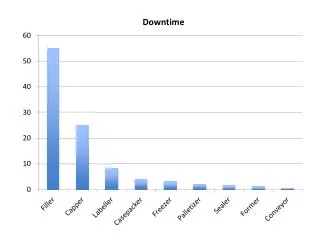
The Pareto Chart A Pareto chart is a graphical representation that displays data in order of priority.
This is a simple example of a Pareto diagram using sample data showing the relative frequency of causes for errors on websites. It enables you to see what 20% of cases are causing 80% of the problems and where efforts should be focused to achieve the greatest improvement.
Some ProblemsDifficulties associated with pareto analysis • Misrepresentation of the data. • Inappropriate measurements depicted. • Lack of understanding of how it should be applied to particular problems. • Knowing when and how to use Pareto Analysis. • Inaccurate plotting of cumulative percent data.
Overcoming the difficulties • Define the purpose of using the tool. • Identify the most appropriate measurement parameters. • Use check sheets to collect data for the likely major causes. • Arrange the data in descending order of value and calculate % frequency and/or cost and cumulative percent. • Plot the cumulative percent through the top right side of the first bar. • Carefully scrutinize the results. Has the exercise clarified the situation?
Pareto Analysis Example Ahmet has taken over a failing service center, with a lot of problems that need resolving. His objective is to increase overall customer satisfaction. He decides to score each problem by the number of complaints that the center has received for each one.
Ahmet then groups problems together (steps 4 and 5). He scores each group by the number of complaints, and orders the list as follows: • Lack of training (items 5 and 6) – 51 complaints. • Too few service center staff (items 1 and 42) – 21 complaints. • Poor organization and preparation (items 3 and 4) – 6 complaints
It is the discipline of organizing the data that is central to the success of using Pareto Analysis. Once calculated and displayed graphically, it becomes a selling tool to the improvement team and management, raising the question why the team is focusing its energies on certain aspects of the problem.