Download
1 / 20
210 likes | 239 Views
Global Migration. Ken Keller - DHS AP Human Geography 2004. There has been a huge increase in international migration – 150 million (3% of world’s population live outside countries of birth (32.5 million in U.S.).

E N D
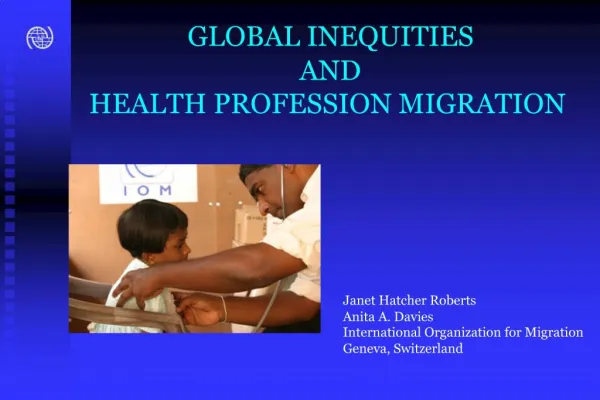
Global Migration Ken Keller - DHS AP Human Geography 2004
There has been a huge increase in international migration – 150 million (3% of world’s population live outside countries of birth (32.5 million in U.S.) • Growing inequalities between North and South – moves to increase living standards. • Increasing demographic pressure in high-growth regions of NA, Asia, and Africa. • End of the Cold War – massive population shifts in Europe. • Increasing ethnic and political strife for example, in Yugoslavia, Rwanda, Chechnya, Middle East, Liberia, Iran, Iraq.
Trends over past 25 years • Globalization of migration – more countries are affected by migration at the same time. • Acceleration of migration – once migration starts, it is likely to snowball through chain migration. • Differentiation of migration – more different types of migration (refugees, family migrants, labor force migrants). • Feminization of migration – women are playing an increasing role in all regions and all types of migration.
History of international migration • Pre-19th Century • Warfare, conflict, formation of nations and emergence of states. • Slavery – By 1790, there were 2.5 million African slaves in the Americas • In 1790, 19% of US population was black. • Triangular trade: ships with manufactured goods (salt, hardware, weapons, rum) from England to W. Africa, Africans to N and S America and plantation goods (sugar, tobacco, molasses) back to England.
19th Century Migrations • Colonial migrations • British recruited 30 million from Indian subcontinent to work on sugar plantations in the Caribbean. Also to E. Africa. • Dutch used Chinese in Dutch E. India (Indonesia) • Europeans to U.S. Canada, Australia • Irish to Britain to work in textile factories, building trades, and on railroad. • Europeans to France because of low birth rates.
Post-WWI Movement • Little movement during inter-war period due to economic stagnation and isolationism. • WWII to 1970 • European guest workers – from Mediterranean countries (Italy,Yugoslavia, Turkey, Spain, Algeria, Greece) to Britain, Belgium, France, Switzerland, Netherlands, and Germany. Filled post-War labor shortage, but were reluctant to go home when shortage passed. • Germany: “We asked for workers and we got people” Migrants brought family members. Now people are free to move within European Union.
36% Luxembourg 19% Switzerland 9% Austria 9% Germany 9% Belgium 6% France 6% Sweden 5% Denmark 4% Netherlands 4% Norway 4% United Kingdom 3% Ireland\ 2% Spain 2% Italy Foreign Born as % of European populations Cornerstone of EU is freedom of movement. 10 countries have been invited to join in 2004-5, including Cyprus, Czech Rep.,Estonia, Hungary, Latvia, Lithuania, Malta, Poland, Slovakia, Slovenia. Why not Turkey?
Other 20th Century movements • WWII to 1970 continued • Colonial workers: from Ireland to England; from former British colonies in the Caribbean and Indian subcontinent to Britain; Algerians, Moroccans, and Tunisians to France; Indonesians to Netherlands. • Europeans to Canada and Australia (restrictive immigration laws keep U.S. immigration low until mid-1960s • Bracero “strong arm” Program brought 4.6 million Mexican guest workers to U.S. between 1942 and 1964 to work in agriculture. Facilitated growth of fruit and vegetable production in SW and seeded later migration streams.
Recent and current migration “hot spots” 1. Eastern Europe and Former Soviet Union 2. Middle East (SW Asia) 3. Sub-Saharan Africa 4. Latin American and Caribbean 5. Asia
Eastern Europe and Former Soviet Union • Fall of Soviet Union creates economic collapse and freedom to seek foreign residence. • East Germans move to west. • Hungary, Poland, Czech Rep., and Slovakia emerge as immigration buffer zones between more unstable places to the East and Western Europe. • Poles seek work in Dutch and German agriculture, and Russians and Ukrainians work in Poland. • Bulgarian Turks return to Turkey.
Middle East • Initially, wealthy oil states imported labor from Egypt, Tunisia, Jordan, and Palestine. Concern about militancy led to importation of workers from Philippines, Sri Lanka, India, Pakistan, and Bangladesh. • Huge return migration during 1990-91 crisis in Kuwait. • Foreign workers represent 60 to 90% of labor force in most oil-exporting countries. • Jewish immigrants to Israel. To replace Palestinians, Israel also allows entry of Romanians, Thais, and other foreign workers.
Africa – includes refugees and migrants. • 1/4 of world’s 20 million refugees are in Africa. National borders, drawn by Europeans, do not reflect ethnic or tribal boundaries. 2 million Rwandans left for Zaire in 1994.
African migration • Environmental migrants – from Mauritania and Mali because of drought. • South Africa imports mine workers from Lesotho, Swaziland, and Mozambique. • Civil war in Liberia • Economic migrants to former colonial rulers.
Latin America and Caribbean • Traditional area of immigration. Italians to Argentina between 1947 and 1955. Brazil received African slaves until 1900 and Japanese workers until 1950. • Shift to outmigration around 1970. • Huge economic disparities between NA and US • Rapid population growth in region. Mexican population grows from 20 mil. in 1940, to 100 mil. today • Temporary worker programs created the networks that later developed into permanent flows. • Major origin countries for US immigration: Mexico, Nicaragua, El Salvador, Haiti, and Cuba.
Asia • U.S., Canada, and Australia relaxed immigration laws in 1960s and 1970s. • US military presence in SE Asia. GI brides seeded networks as well as refugees. Vietnam and Philippines. • Labor migrants from India and China • Contract labor to Middle East • Refugees: 2 million Afghans in Pakistan. • Labor migration from Thailand, Indonesia, and Philippines to S. Korea, Taiwan, and Singapore. • To Japan • Women from Philippines and Korea to work as dancers, waitresses, and hostesses • Return of South American Japanese
Most refugees are returned to place of birth. A small proportion are permanently resettled.