Download
1 / 37
380 likes | 421 Views
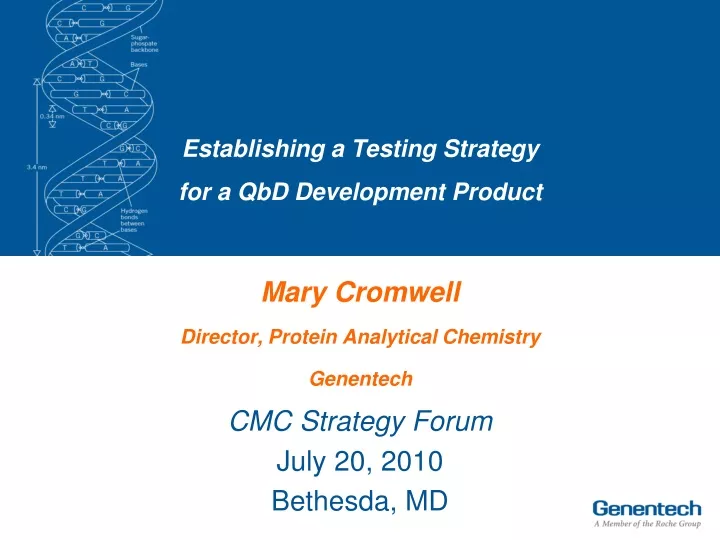
Establishing a Testing Strategy for a QbD Development Product. Mary Cromwell Director, Protein Analytical Chemistry Genentech CMC Strategy Forum July 20, 2010 Bethesda, MD. A-MAb Case Study: Elements of the Control Strategy. Raw Material Control. Procedural Controls.

E N D
Establishing a Testing Strategy for a QbD Development Product Mary Cromwell Director, Protein Analytical Chemistry Genentech CMC Strategy Forum July 20, 2010 Bethesda, MD
A-MAb Case Study: Elements of the Control Strategy Raw Material Control Procedural Controls Process Parameter Controls Process Control In-Process Testing Specifications (Lot Release and Stability) Testing Characterization and Comparability Testing Today’s Discussion Process Monitoring Continual Process Verification
Key Tools and Information Used to Develop a Testing Strategy for a QbD Product
Quality Attribute Impact Score 1 Based on a relevant potency assay and dependent on assay variability 2 Based on serum exposure (AUC) or FcRn binding. PD considered if information available 3 Based on effects observed in clinical studies P. Motchnik
CQA Acceptance Criteria (CQA-AC) and Target Ranges (CQA-TR) • CQA-AC: • Numerical limits that must be met for the product to be considered acceptable • Based on non-clinical and clinical experience, platform knowledge and literature (with appropriate justification of applicability of data used) • Based on patient impact only - process capability is not considered • May change as product gains more clinical experience, not as a function of additional manufacturing experience • CQA-TR: • Constrained range of the CQA-AC to ensure that the process will always deliver product within the CQA-AC
Attribute Testing Strategy Risk Ranking and Filtering Tool Quality Attribute Impact Score Process or Stability Impact Score X = ATS (1) 2, 4, 12, 16, 20 1, 2, 4, 10 2-200 • Performed for: • DS manufacturing process • DP manufacturing process • DS storage • DP storage • Defines Testing Strategy: • No Testing • “Comparability and Monitoring” • Control System (Release, Stability, • and/or In-Process) (1) Attribute Testing Strategy
Process Impact Scoring Decision Tree: Used for DS and DP Manufacturing Processes representative process model exists QA Impact Score of 2 or 4 Abundance 0-1%* Start: For each Quality Attribute No No Yes Yes Yes No Process Impact Score = 4 Process Impact Score = 1 Process Impact Score = 10 *specific for product-related impurities; for HMWS, Abundance threshold is <0.1% PC/PV Outcome Difference: Actual Result to CQA-TR Highly Robust Default Process Impact Score = 10 Process Impact Score = 4 Process Impact Score = 2 N. McKnight
Stability Impact Scoring Decision Tree Can molecule form attribute? Process Impact Score = 1 No Start: for each Quality Attribute Yes Rate of change relative to CQA-AC Fast Process Impact Score = 2 Slow Process Impact Score = 10 Moderate Process Impact Score = 4 (>33%*) (< 11%*) *of allowable range; Assessed to expiry at recommended storage temperature and for allowable excursions (11-33%*) R. Wong
“Comparability and Monitoring” (CaM) • Attribute class to be tested as part of: • Comparability exercises • Performed to support site transfer, version changes, scale changes • Provides streamlined testing • Testing includes appropriate (DS or DP) tests designated “CaM” in the Testing Strategy as well as Control System testing (IP, Lot Release, Stability) • Choice of tests based on risk associated with change; only CaM attributes known to be impacted by particular step that is changing will be tested • Process Monitoring • Continuous Process Verification • Subset of CaM attributes • Frequency of monitoring may be attribute dependent • Control System testing • Key Performance Indicators
MAb 1: Background • Target Product Profile • Immunology indication • Drug will be administered IV monthly for six months • Doses up to 5X of proposed marketed dose given in clinical trials • Very low immunogenicity rate • Safety profile well established • Product characterization • Effector function required for potency • CDC (terminal galactose distribution) • ADCC (afucosylation) • CDR deamidation, fragmentation, aggregation impact potency • Deamidation increases ~ 6% on DP storage (allowable range = 9%) • Fragmentation increases ~1% on DP storage (allowable range = 5.8%) • Aggregation does not change on storage of DS or DP
Key Tools and Information Used to Develop a Testing Strategy for a QbD Product
Robustness Assessment of Testing Strategy • Testing Strategy Tool used to develop the proposed Control System • Is proposed testing strategy of sufficiently low risk? • Do proposed methods provide adequate control? • Robustness Assessment Tool considers • ATS score (reflecting CQA Impact and Process/Stability control) • Sensitivity of method used for analysis • Testing Strategy (Control System, “CaM”, no testing) • Expected to be iterative process: Unacceptable score indicates that • Testing strategy may need to change • A more sensitive method may be required for testing attribute • Manufacturing process may need to provide greater process control • Shelf-life/allowable excursions may need to be shortened
Robustness Assessment of Testing Strategy Attribute Testing Score Testing Strategy Score X = Robustness Score 2-200 2, 4, 6, 10 4 - 2000 Score </= 400 indicates Robust Control Strategy
Robustness Assessment for Afucosylation: Glycan Assay • Control of afucosylation by CE-glycan assay is ROBUST
Robustness Assessment for Afucosylation: ADCC Potency Assay • Control of afucosylation by ADCC potency assay is • NOT ROBUST • high impact CQA • low process control
Proposed Control System for MAb 1: Drug Product In-Process Testing
Proposed Control System for MAb 1: Drug Product Lot Release and Stability
Proposed Control System: MAb 1 Drug Substance In Process Testing CE = capillary electrophoresis. a Direct measure of osmolality, indirect measure of excipient concentrations
Proposed Control System: Drug Substance Lot Release and Stability
Approach Applied to a Second MAb • MAb 2 Background • Binds to and blocks receptor on cell; effector function not required for MOA • Oncology indication • Molecule is exceptionally stable; forced degradation studies cannot generate deamidation, oxidation, or glycation of CDR sites • Limited number of CQAs requiring control • Therefore, limited number of CPPs to constrain Design Space
MAb 2 Proposed Control System Drug Substance CoA/Stability Drug Product CoA/Stability
Summary • Risk-based tools developed to define Testing Strategy and Control System • Utilizes knowledge of • CQA Impact on potency, immunogenicity, safety, and PK/PD • Process Impact • Stability Impact • Specificity and Sensitivity of analytical method • Assigns attributes to three categories of testing • Control System (Lot release, stability, in-process) • “Comparability and Monitoring” • No testing • Robustness assessment for control of CQAs • Iterative process • Evaluates risk that control strategy is insufficient
Summary, continued… • Use of filters in assessment of testing strategy • Abundance filter as part of Process Impact, not CQA ID • Default process impact score for low impact quality attributes • Balances wide CQA Acceptance Criteria with potentially little process impact knowledge
Advantages of the QbD Approach to Developing a Control Strategy • Clear, logical approach – applicable to all types of biologics • Control Strategy development relies on significant process and product knowledge • Clear rationale for selection of attributes to test and the type of testing strategy applied can lead to streamlined Control System testing • Understanding impact of each process step to CQA levels leads to targeted testing for comparability • Only test those attributes impacted by changed steps
Acknowledgements Jerry Dong Lynn Gennaro Yung-Hsiang Kao Paramjit Kaur Daniel Kelati Brian Kelley Lynne Krummen Reed Harris Kathy Hsia Raquel Iverson Kim Latimer Nadja Alt (Roche) Bernd Hilger (Roche) Joseph Marhoul Nathan McKnight Paul Motchnik Dave Reifsnyder Sofia Ribeiro Natalie Saldou-Holtz Cristina Sanchez Dieter Schmalzing Ron Taticek Pin-Yee Wong Rita Wong
MAb 1: Attributes that Require No Testing for Drug Substance