Download
1 / 73
740 likes | 769 Views
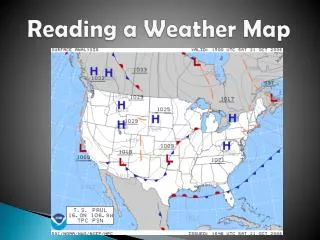
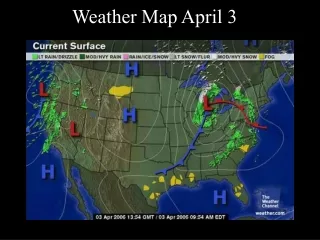
Surface Weather Map. a.k.a: Surface Synoptic Chart ATMS 101 W2019. Available here: http://www.atmos.washington.edu/data/vmaproom/. Why Surface Weather Maps?. Summarizes weather conditions at the surface (where we are!) Using a progression of charts can see how weather is evolving.

E N D
Surface Weather Map a.k.a: Surface Synoptic Chart ATMS 101 W2019
Available here: http://www.atmos.washington.edu/data/vmaproom/
Why Surface Weather Maps? • Summarizes weather conditions at the surface (where we are!) • Using a progression of charts can see how weather is evolving. • Summarizes our conceptional model of the atmosphere (fronts).
First Surface Weather Map • Created by H. W. Brandes in 1820 for March 6, 1783. • The arrows indicate wind direction and the lines show the deviation of pressure from average conditions
One of the weather maps created by Elias Loomis in his groundbreaking paper on the storms of February 1842. • Surface wind direction is indicated by arrows and the deviations from average pressure are shown by the dashed lines. Temperatures are indicated by dotted lines and the sky or precipitation type by the color shading. This map indicates a strong low-pressure center over the Ohio Valley, rain on the coast, and snow-laden northwesterly winds to the west.
The Telegraphic Communication Revolution • By 1849 a telegraphic network was organized in the United States for the transmission of daily meteorological observations for a collection of stations. • In England during the l851 World's Fair, there was a daily weather maps for display, and by 1859 the British Meteorological Department began to operationally distribute weather information using this new technology. The internet of the 19th century
The weather maps of the 1800s were missing something all maps have today:FRONTS
Fronts • The Norwegian Cyclone Model, around 1920
Fronts Regions of enhanced temperature changes and major weather (clouds and precipitation)
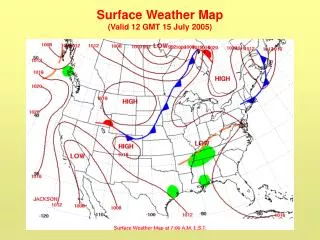
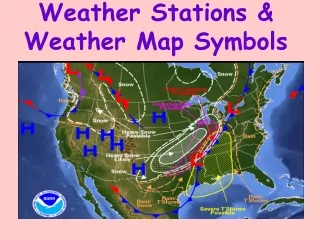
What is on surface charts? • Station models: meteorological shorthand describing the observations at locations • Isobars (lines of constant sea level pressure) • Fronts and troughs (locations of low pressure)
Station Model • In the U.S., the station model uses temperatures in F; other countries used C • Sea level pressure. 3 digits in tenths of a hPa (mb). • Divide by 10 and add either 9 or 10. • 237 > 23.7>1023.7 hPa • When choosing between 9 and 10, use the one that gives one a reasonable pressure (hint: average SLP is around 1000 hPa)
Practice • 198 is 1019.8 hPa, not 919.8 hPa • 745 is 974.5 hPa, not 1074.5 hPa • 247 is 1024.7 hPa, not 924. 7 hPa
Pressure Change over the Past 3 hr • Surface pressure change in tenths of hPa • Over past 3 hr. • 3 means pressure increase of .3 hPa in last 3 hr. • Cartoon next to it.
ASOS: Automated Surface Observing System: Backbone Observing System in the U.S.: Mainly Airports
Laser Weather Identifier
Anemometer Wind Vane Laser Ceilometer
Ocean and Lake Weather Buoys Anchored
Drifting Buoys Pressure Wind
Ship Reports: Marine VOS Program Volunteers Observers--generally 6-hourly reports Highly variable quality and frequency
Isobars of sea level pressure are found on station map • Isobars are lines of constant or equal pressure • Everywhere along each line the pressure is the same • Labeled in hPa/mb (e.g., 996, 1000, 1004, etc)
Why use sea level pressure rather than station pressure—the pressure at the elevation of the barometer? • Because pressure decreases with height! • Thus, the pressure variations on weather maps would be dominated by terrain changes in station or surface pressure was plotted.
Terrain effects on pressure would swamp the meteorological signal • So why not take the terrain effects of pressure out? • Adjust the station (surface) pressures to get the pressure at a standard level: sea level. • Called pressure reduction to sea level. • For example, near sea level, pressure drops about 1 hPa for every 8 meters in elevation.
Example of Pressure Reduction * 1024 hPa 64 m Sea Level * 1032 hPa