Download
1 / 34
340 likes | 345 Views
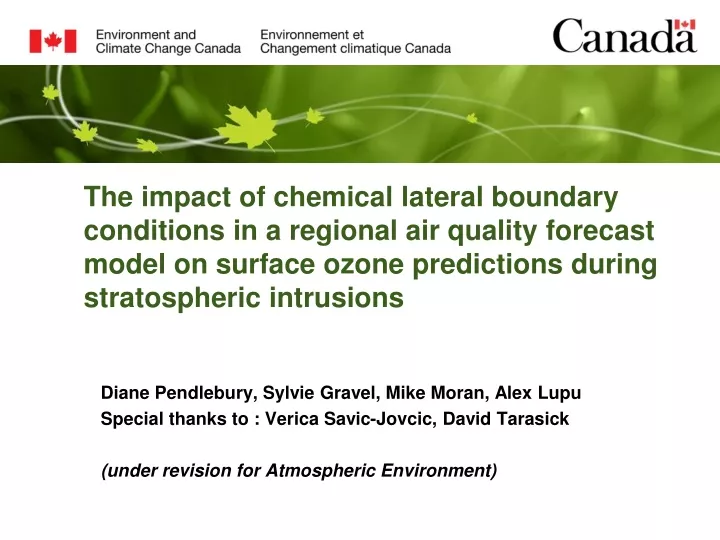
The impact of chemical lateral boundary conditions in a regional air quality forecast model on surface ozone predictions during stratospheric intrusions. Diane Pendlebury, Sylvie Gravel, Mike Moran, Alex Lupu Special thanks to : Verica Savic-Jovcic, David Tarasick

E N D
The impact of chemical lateral boundary conditions in a regional air quality forecast model on surface ozone predictions during stratospheric intrusions Diane Pendlebury, Sylvie Gravel,Mike Moran, Alex Lupu Special thanks to : Verica Savic-Jovcic, David Tarasick (under revision for Atmospheric Environment)
Outline • Tropospheric ozone and stratospheric intrusions • About GEM-MACHv2 and lateral boundary conditions • Description of experiments • Results • Focus on the 7-15 June 2010 event over the Western US • Describe the event – synoptic picture, changes in ozone • Impact on surface ozone • Comparison to ozonesondes (CalNex campaign) • Comparison with surface observations (hourly ozone data) • Summary and conclusions
Tropospheric ozone • In the troposphere ozone is produced by the interaction of sunlight and chemical precursors (NOx, CO, VOCs) that are emitted by transportation, industry, biomass burning, lightning, etc. • Tropospheric ozone can be enhanced by the transport of stratospheric air, which is rich in ozone, into the troposphere (and even directly to the surface) by stratospheric intrusions
Stratospheric Intrusions • Stratospheric intrusions are the main mechanism for stratosphere-to-troposphere transport in the mid-latitudes and occur due to the meandering of the jet stream • During an intrusion event, the tropopause is highly distorted (tropopause fold) and filaments of stratospheric air may be sheared off into the troposphere • Stratospheric intrusions: • Bring air into the troposphere that is chemically distinct – high ozone, low CO and low relatively humidity • Can bring stratospheric air directly to the surface, increasing surface ozone (deep intrusions) • Even if the stratospheric air does not reach the surface directly, pockets of stratospheric air can remain in the mid-troposphere for ~2 weeks and ozone can later be entrained into the boundary layer
Tropopause folding event 13 March 1978 • Produced from data from NCAR Sabreliner flight (track in green) • Potential temperature (K) red lines; wind speed (m/s) in blue • Tropopause (PV surface) - thick solid black line • Exchange can occur through diabatic processes • Adiabatic descent along downward sloping isentropes 150 360 40 13 350 20 30 340 360 12 200 350 11 340 330 10 330 300 9 320 50 60 70 8 310 Pressure (mb) 400 Height (km) 7 10 6 320 500 5 40 600 300 4 310 30 700 5 300 20 3 100 km 800 2 900 290 1 10 Arizona California 1000 121 VBG 119 SAN 117 UCC 115 ELY 113 After Shapiro, JAS, 1980
Regional GEM-MACH v2 • GEM-MACH isECCC'soperational AQ model • limited-area (LAM) withgrid points co-locatedwithoperational GEM,which supplies meteorologicalinitial conditions and lateral boundary conditions for GEM-MACH • 10-km horizontal gridspacing, 80 vertical levels to 0.1 hPa • One-way coupling (met affects chem) • Full processrepresentation of oxidant and aerosolchemistry: • gas-, aqueous- & heterogeneouschemistrymechanisms • aerosoldynamics • dry and wetdeposition (including in- and below-cloud scavenging) • National emissions inventories processed with SMOKE • Canada 2010, USA 2011, Mexico 1999 • Biogenic emissions • Adjust emissions rates online according to meteorology • Initial and Boundary Conditions • Use previous forecast as initial conditions • “Piloting” from the operational GEM runs • chemical piloting: using a chemical climatology at the boundaries
Experiments using regional GEM-MACHv2 • Focus on spring 2010 – 1 April to 30 June • There were 5 strong stratospheric intrusion events from April to June that are well documented (Lin et al., 2012, JGR) • Four sets of lateral boundary conditions for ozone : • MOZART4 : chemical lateral boundary conditions that are based on a seasonal “climatology” from MOZART4 (current operational method) • MACCRean : ozone lateral boundary condition from MACC reanalysis • Updated every 6 hours (00, 06, 12, 18 GMT) • GM-GLOBAL : Version of GEM-MACH that uses global emissions that are well known for 2010 (part of the Hemispheric Transport of Atmospheric Pollutants project or HTAP) • Uses gas phase chemistry and dry deposition only; 100 km grid spacing • Updated every hour of forecast • DynOzone : Based on a pair of ozone climatologies (one for the troposphere and one for the stratosphere) produced from ozonesonde data and back-trajectories to fill in gaps – Liu et al., ACP, 2013a;b.
Comparing ozone lateral boundary conditions Western lateral boundary for 12 June 2014 00Z • MOZART4 ozone on LB is constant (based on seasonal average) MACCRean ozone is updated every six hours • GM-GLOBAL ozone is updated every hour • DynOzone is updated every hour based on sonde climatologies • Everything else is the same! S N S N Tropopause definitions GEM-MACH thermal tropopause (WMO) GEM-MACH potential vorticity (dynamical) GEM-MACH kinetic energy (jet location) S N S N
Synoptic picture from GEM-MACH on the 0.239 hybrid surface – 12 June 2010 09:00UTC Wind speed Relative humidity 2 PVU contour (gray) Upper level trough Jet stream Descent of very dry air Downward sloping potential temperature
Cross section of ozone 13 June 2010 21:00UTC Cross section is chosen to go through area of maximum impact Much more ozone available Very little ozone available for STE x Lower surface ozone Higher surface ozone
Difference in surface ozone at 13 June 2010 21:00UTC (modified run vs MOZART4) • More surface ozone entering through the western lateral boundary • Less ozone entering through the southern lateral boundary for MACCRean and GM-GLOBAL (but higher for DynOzone) • More surface ozone around the edges of the upper level trough – due to the stratospheric intrusion x
Comparison with observations CalNex site map • The CalNex campaign was operating 10 May 2010 to 20 June 2010 so there are nearly daily ozonesondes from these stations (ozone-sondings are usually made weekly) • Near-daily ozonesondes were taken at six sites in California and in Kelowna, BC • Hourly ozone measurements are made by the Air Quality System (AQS) network, CASTNET (Clean Air Status and Trends NETwork), and the NAPS (National Air Pollution Surveillance) program for North America • Surface observations are matched to model data for each station and hour for the entire period (April to June) • Compare mean bias, correlation and slope (observations vs. model)
O3-Sonde Comparison with ozonesondes MACCRean MOZART4 GM-GLOBAL DynOzone 2010-June-09 2010-June-10 2010-June-11 2010-June-12 2010-June-14 14 10 PointSur Height [km] 6 2 14 10 Joshua Tree Height [km] 6 2 Profiles are all grid points within a 25 km radius of the ozonesonde station
3-day aggregated results for New Mexico (26 stations) Mean Bias • A negative bias in the MOZART4 run is partially corrected using the modified runs, but is over corrected for DynOzone • Very little impact on correlation • Slope is often improved in all of the modified runs especially during stratospheric intrusions. Correlation Slope (obs vs model)
Mean Bias 3-day aggregated results for Wyoming (15 stations) • A negative bias in the MOZART4 run is partially corrected using the modified runs, but is sometimes over corrected for DynOzone • There is more impact on the correlation (fewer stations), especially towards the end of the season • Slope is often improved in all of the modified runs especially during stratospheric intrusions. Correlation Slope (obs vs model)
Improvement over control run for aggregated results (April-June 2010) Mean Bias (ppbv) – red is better 0 -5 5 Correlation – blue is better -0.1 0.0 0.1
Aggregated result by region for 3-month period Regions are divided by impact of LBCs and intrusions Red=worse, gold=better Mean bias Correlation
Summary and Conclusions • All modified ozone LBCs show improvement over the seasonally averaged MOZART4 LBCs in surface ozone particularly in Western NA • The surface ozone is improved when the relationship between the ozone gradient and the tropopause is properly captured. • MACCRean was expected to give the best results since the ozone is an assimilated product and therefore a ‘best guess’ of actual ozone, but it did not give the best performance. Note: It can only be used for hindcasts. • GM-GLOBAL often shows consistent improvement especially in the correlation and could be used operationally in the future. • DynOzone run shows that the method is promising but because of very high surface ozone along the southern lateral boundary, this particular dataset cannot be used operationally. • GEM-MACH simulations for a second period (1-15 June 2014) agree with these results
Other considerations • Climate considerations: • ENSO – El Niño tends to have enhanced ozone in the UT but its effect does not reach the surface; La Niña years tend to have a more meandering jet stream and therefore more intrusions (Lin et al., Nature Comm., 2014) • Quasi-biennial oscillation changes the stratospheric circulation changing ozone transport • Changes in the stratospheric circulation due to climate change and the recovery of the ozone layer are projected to increase stratosphere-troposphere exchange of ozone and increase the tropospheric ozone by 2% in the northern mid-latitudes • Trans-hemispheric transport of polluted air – part of the same mechanism that produces stratospheric intrusions • climatological means will not deal with this episodic process
Surface ozone 13 June 2010 21:00UTC Surface ozone reaches only 55 ppbv Surface ozone reaches 115 ppbv! x
20 – 24 May 2010 intrusion event : Difference in surface ozone at 23 May 2010 18:00UTC Surface ozone is decreased with modified LBCs During this intrusion, the impact of the ozone is shifted for MACCRean and GM-GLOBAL.
Impact on mean bias over 3-month period April – June (3-day aggregated) New Mexico (26) Arizona (48) Utah (19) California (164) Colorado (29) Wyoming (15)
Impact on correlation over 3-month period April – June (3-day aggregated) New Mexico (26) Arizona (48) Utah (19) California (164) Colorado (29) Wyoming (15)
Impact on slope of obs vs model ozone over 3-month period April – June (over 3 days) New Mexico (26) Arizona (48) Utah (19) California (164) Colorado (29) Wyoming (15)
Impact of southern boundary on surface ozone: Texas (3-day aggregated, 75 stations) • Texas is not (significantly) affected by the stratosphere intrusions but is very close to the southern lateral boundary. • Both MOZART4 and DynOzone LBCs are climatologies and do not reflect daily (hourly) changes in the surface ozone. • MACCRean and GM-GLOBAL inject less ozone through the southern lateral boundary (sporadic) that greatly improve the agreement with observations at certain times. • Other southern states are similarly affected Mean bias Correlation Slope
Curtain through stations : 12 June MACCRean GM-GLOBAL DynOzone MOZART4
Figure 4. Cross section along the HIRDLS FOV track (shown on the NA map in Figure 5a) on May 11, 2007. The layer structure of the intrusion is consistently shown in the ozone cross section measured by HIRDLS (upper) and the PTLR cross section based on the GFS analyses (lower). The GFS analyses thermal tropopause (black dots), zonal wind (black contour), 350 and 400 K isentropes (black broken) and PV (2, 4, 6, and 8 pvu) contours are shown on the cross sections. High resolution figure High resolution figure 5a High resolution figure 5b Figure 5. Sandwiched stratosphere sampled by NCAR GV during START08 April 18, 2008. (a) The region of double tropopause over North America based on high resolution NCEP/GFS meteorological analyses. The colors represent the minimum potential temperature lapse rate (dq/dz (K/km)) between the two tropopauses. The red line marks the segment of the flight track shown in panel (b and c). (b) Cross along the flight track with potential temperature lapse rate (color image), potential vorticity (purple contours), potential temperature (black contours) and the GV flight track (colored by the ozone values). (c) GV measurements during the segment including pressure altitude (gray), potential temperature (black), ozone (red) and carbon monoxide (blue). High resolution figure 5c Figure 6. Comparison of HIRDLS and CALIPSO cloud occurrence frequency in April 2007. High resolution figure Figure 7. MODIS ice effective radii for clean and polluted clouds. High resolution figure Stratospheric temperature trends ACD scientists helped organize an updated assessment of stratospheric temperature trends, based on radiosonde, satellite and lidar measurements. This work was performed over the last several years in collaboration with a group organized under the WCRP SPARC Program. Satellite data include measurements from the series of NOAA operational instruments, including the Microwave Sounding Unit (MSU) covering 1979-2007 and the Stratospheric Sounding Unit (SSU) covering 1979-2005. Radiosonde results were compared for six different data sets, incorporating a variety of homogeneity adjustments to account for changes in instrumentation and observational practices. Temperature changes in the lower stratosphere show cooling of ~0.5 K/decade over much of the globe for 1979-2007. Substantially larger cooling trends are observed in the Antarctic lower stratosphere during spring and summer, in association with development of the Antarctic ozone hole. Trends in the middle and upper stratosphere have been derived from updated SSU data, taking into account changes in the SSU weighting functions due to observed atmospheric CO2 increases. The results show mean cooling of 0.5-1.5 K/decade during 1979-2005, with the greatest cooling in the upper stratosphere near 40-50 km. Temperature anomalies throughout the stratosphere were relatively constant during the decade 1995-2005. These observations will be utilized for detailed comparisons to model results within the SPARC CCMval Project. Forcing of the tropical Brewer-Dobson circulation The Brewer-Dobson upwelling in the tropical lower stratosphere is a dynamically-forced phenomenon, with a pronounced annual cycle leading to seasonal variations in stratospheric temperature, water vapor and other constituents. ACD scientists used diagnostic studies to quantify the dynamical forcing of large-scale upwelling in the tropical lower stratosphere, based on circulation statistics from ERA40 and NCEP/NCAR reanalysis data. Zonal mean upwelling derived from momentum balance and continuity (so-called downward control) was found to be in reasonable agreement with independent calculations based on thermodynamic balance. The detailed momentum balances associated with the dynamical upwelling were investigated, in particular the contributions to climatological wave forcing (EP flux divergence) in the subtropics. Results showed that the equatorward extension of extratropical waves (baroclinic eddies and, in the NH, quasi-stationary planetary waves) contribute a large component of the subtropical wave driving near the tropical tropopause. Additionally, there is a significant contribution of forcing from equatorial planetary waves forced by tropical convection. The observed balances demonstrate that the strong annual cycle in upwelling across the tropical tropopause is forced by subtropical eddy momentum flux convergence associated with waves originating in both the tropics and extratropics. Additionally, tropical upwelling is found to systematically increase in simulations of future climate. (link) Transport and chemistry of the Asian monsoon anticyclone The Asian monsoon anticyclone is a region of persistent pollution in the upper troposphere during Northern Hemisphere summer, resulting from vertical transport of surface pollution in deep convection, and confinement by the strong anticyclonic circulation. This circulation extends into the lower stratosphere, and may be an important mechanism for troposphere-stratosphere coupling. ACD scientists used short-lived chemical species measured by Atmospheric Chemistry Experiment Fourier Transform Spectrometer (ACE-FTS) to explore chemical behavior of the Asian monsoon anticyclone. The climatology of carbon monoxide (CO) measured by ACE-FTS shows a local maximum in the Asian monsoon anticyclone region (Fig. 1). Other short-lived species measured by ACE-FTS, such as hydrogen cyanide (HCN), ethane (C2H6) and acetylene (C2H2), which have common sources of biomass burning, show maximum enhancement inside the anticyclone near the tropopause (Fig. 2a). The photochemical age of air was estimated by the ratio of C2H2/CO, indicating that air inside the anticyclone is relatively young (Fig. 2b), i.e. this air has was recently transported from lower altitudes. Ongoing work is aimed at understanding the transport pathways within the monsoon region, and quantifying the effect of convective transport and large-scale circulation in the UTLS region. Microphysics parameterization for CAM ACD and CGD scientists have been leading a collaborative development effort for a new microphysics parameterization for CAM. The goal of this effort is to develop an advanced microphysics package which can represent the size of cloud drops, and simulate how cloud drops are influenced by the distribution of aerosols. The ultimate goal is to quantify aerosol indirect effects in CAM and CCSM. This work dovetails with other studies in ACD, MMM and CGD of cloud microphysics, both in observations and in models. An important component of the broader activity is the development of better satellite data sets of cloud microphysical properties for comparing the CAM and WACCM simulations to observations. This work has recently been extended to treat the effects of ice clouds and ice cloud aerosol interactions. Evaluating model simulations of the Tropical Tropopause Layer ACD scientists and collaborators also analyzed the representation of the Tropical Tropopause Layer (TTL) in global models. Comparisons of a number of diagnostics with observations indicate that global models are capable of representing TTL structure and variability well on many scales. TTL structure in 13 different chemistry - climate models has been analyzed, and the performance of the models and their representation of the past and future explored. Comparisons indicates that convection within the TTL itself is not critical for TTL structure, though convection below the TTL is important. Most models predict the tropical tropopause will get higher and slightly warmer in Cross section along the HIRDLS FOV track on May 11, 2007. The GFS analyses thermal tropopause (black dots), zonal wind (black contour), 350 and 400 K isentropes (black broken) and PV (2,4,6,8 PVU) Pan et al.,??? I have sthis somewhere