Download
1 / 18
250 likes | 417 Views
Uncertainty in Measurement. Accuracy, Precision, Error and Significant Figures. Objectives. Define and compare accuracy and precision. Describe the accuracy of experimental data using error and percent error.

E N D
Uncertainty in Measurement Accuracy, Precision, Error and Significant Figures
Objectives • Define and compare accuracy and precision. • Describe the accuracy of experimental data using error and percent error. • Apply rules for significant figures to express uncertainty in measured and calculated values.
Accuracy and Precision • Accuracy refers to how close a measured value is to an accepted value. • Precision refers to how close a series of measurements are to one another.
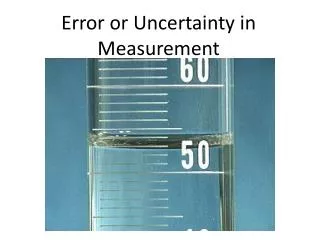
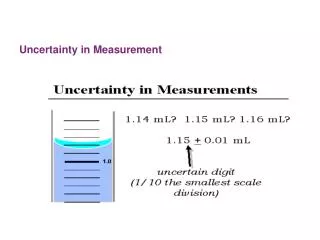
Significant Figures • Precision is limited by the tools available. • Significant figures are the numbers of digits obtained from a measurement. • The significant figures include all known digits plus one estimated digit.
Rules for Determining the Number of Significant Figures • Numbers that are not zero are significant. • A zero in between two nonzero digits is significant. • If a number has a decimal point, all zeroes after a nonzero digit are significant. • If there is no decimal point, zeroes on the right hand side are not significant.
Counting Significant Figures 500 5.404 305 4.000 0.0340
Easy Method Pacific Ocean Atlantic Ocean If decimal is Absent, count from right to left. If decimal is Present, count from left to right. In both cases, begin counting with the first nonzero digit you encounter.
Counting Significant Figures 400 4.20 305 6.907 0.0780
Calculations with Significant Figures • Addition and subtraction • Determine which number has the fewest decimal places. • Round answer to that number of decimal places. • 6.02 + 3.1 = ? • 8.99 - 5.333 = ?
Calculations with Significant Figures • Multiplication and division • Answer has same significant digits as the measurement with least significant digits. • 9.99 / 3 = ? • 9.99 / 3.0 = ?
Calculations with Significant Figures Main Idea • When rounding an answer after a calculation, the final answer should match the given information in terms of total digits. • If you multiply two 2-digit numbers, the final answer should also have two digits.
Error • Erroris defined as the difference between and experimental value and an accepted value. • The error equation is error = experimental value – accepted value.
Percent Error • Percent errorexpresses error as a percentage of the accepted value.