Download
1 / 47
470 likes | 481 Views
This study explores the efficacy of combining chimeric antigen receptor (CAR) T cell therapy with PD-1 blockade to improve anti-tumor activity. The CAR-T cells were modified to secrete PD-1-blocking single-chain variable fragments (scFv) in both a paracrine and autocrine manner. The results in mouse models showed promising outcomes, similar to or better than combination therapy with checkpoint inhibitors.

E N D
2018 Nobel Prize in Physiology or Medicine. James Allison (University of Texas MD Anderson Cancer Center in Houston) TasukuHonjo (Kyoto University,Japan)
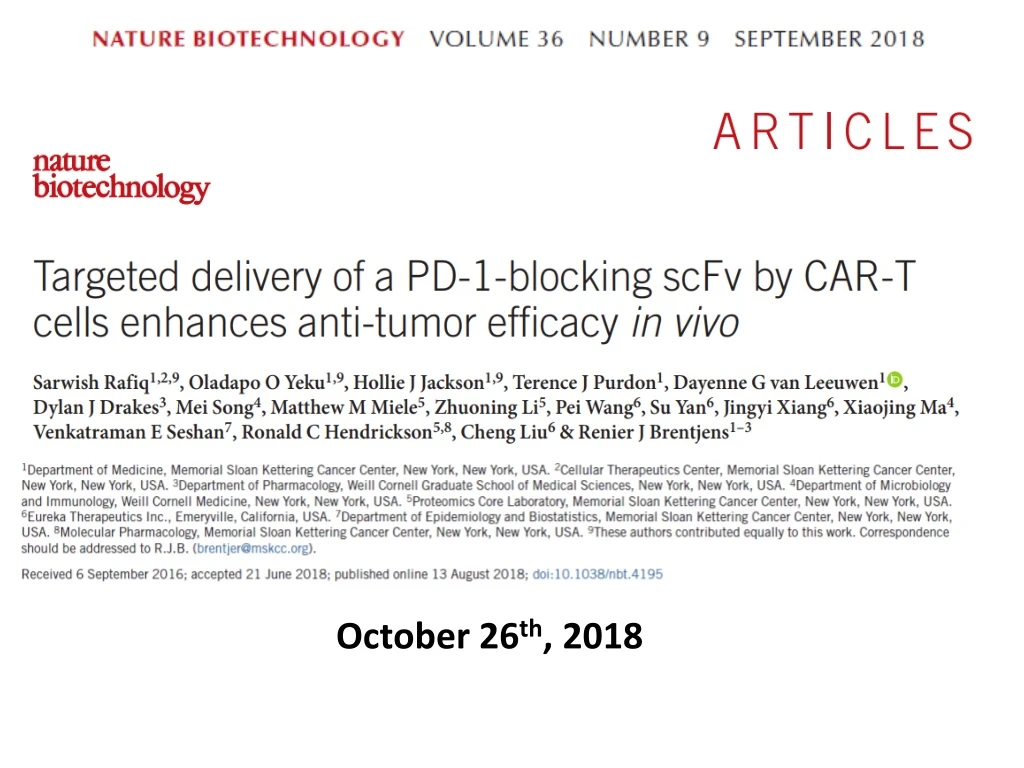
Nat Biotechnol. 2018 Oct;36(9):847-856. doi: 10.1038/nbt.4195. Epub 2018 Aug 13. ABSTRACT The efficacy of chimeric antigen receptor (CAR) T cell therapy against poorly responding tumors can be enhanced by administering the cells in combination with immune checkpoint blockade inhibitors. Alternatively, the CAR construct has been engineered to co-express factors that boost CAR-T cell function in the tumor microenvironment. We modified CAR-T cells to secrete PD-1-blocking single-chain variable fragments (scFv). These scFv-secreting CAR-T cells acted in both a paracrine and autocrine manner to improve the anti-tumor activity of CAR-T cells and bystander tumor-specific T cells in clinically relevant syngeneic and xenogeneic mouse models of PD-L1+ hematologic and solid tumors. The efficacy was similar to or better than that achieved by combination therapy with CAR-T cells and a checkpoint inhibitor. This approach may improve safety, as the secreted scFvs remained localized to the tumor, protecting CAR-T cells from PD-1 inhibition, which could potentially avoid toxicities associated with systemic checkpoint inhibition.
Key Point PD-1 PD-L1 CAR-T ScFv Tumor Microenvironment In vivo Versus In Vitro Synergeic Versus Xenogeneic Autocrine Versus Paracrine
What is PD-1? What is PD-L1? https://www.nippon.com/en/column/g00268/ https://www.genekor.com/en/services/pd-l1/
What is CAR-T? Chimeric Antigen Receptor (CAR) T-Cell Therapy Definition : A type of treatment in which a patient's T cells (a type of immune system cell) are changed in the laboratory so they will attack cancer cells. Source: National Cancer Institute (https://www.cancer.gov/publications/dictionaries/cancer-terms/def/car-t-cell-therapy)
Ahmad, Z. A., Yeap, S. K., Ali, A. M., Ho, W. Y., Alitheen, N. B. M., & Hamid, M. (2012). scFv Antibody: Principles and Clinical Application. Clinical and Developmental Immunology, 2012, 980250. http://doi.org/10.1155/2012/980250 Klampatsa, A., Haas, A.R., Moon, E.K., & Albelda, S.M. (2017). Chimeric Antigen Receptor (CAR) T Cell Therapy for Malignant Pleural Mesothelioma (MPM). Cancers.
Cui Y, Guo G (2016) Immunomodulatory function of the tumor suppressor p53 in host immune response and the tumor microenvironment. Int J MolSci 17: . doi: 10.3390/ijms17111942
Difference between In vivo and in vitro In vivo In Vitro In Latin means “within the glass” In vitro experiment involves the experimentation outside the whole living organism in a controlled laboratory conditions. Example: Cell culture experiments in Petri dishes, or some in test tubes. • In Latin means “Within the living “ • In vivo experiment involves the experimentation using a whole living organism • Example: Use of model organisms such as mice, rabbit, apes etc where drugs are directly injected into the body (drug testing)
Difference between Syngeneic and Xenogeneic Syngeneic Xenogeneic (genetics) derived from a different species and therefore genetically and immunologically incompatible • (genetics) genetically identical, or sufficiently identical and immunologically compatible as to allow for transplantation. Xenotransplantation Technology https://www.taconic.com/taconic-insights/oncology-immuno-oncology/syngeneic-tumor-model-health-standards.html http://www.revivicor.com/technology.html
Difference between Autocrine and Paracrine Autocrine: Paracrine: describes hormone action where hormones are released from cells and bind to receptor on nearby cells and affects their function. • mode of hormone action to which hormones bind to receptors on to the cell and affects the cell that produces it. https://www.dreamstime.com/stock-illustration-cytokine-receptor-signal-transduction-cells-cytokines-endocrine-paracrine-autocrine-secretion-image97427059
Figure 1 Mouse CAR-T cells can be co-modified to secrete the mouse PD-1-blocking scFv RMP1-14. (a) Schematic of the bi-cistronic vectors used for syngeneic mouse studies encoding the CD19-targeted 19m28mZ CAR or ovarian MUC16ecto-targeted 4H11m28mZ CAR, linked with a P2A element to the secretable PD-1-blocking scFv RMP1-14. A c-myc-tag is included for detection of the scFv. (b) Representative flow cytometry plot demonstrating CAR expression following mouse T cell transduction, detected with fluorescently labeled CAR-specific idiotypic antibodies. Data shown are representative of 3 independent experiments. (c) Western blot on supernatant from equivalent numbers of viral packaging cells transduced to express the secretablescFvs with the CAR, detected with anti-myc-tag antibody. Data shown are representative of three independent experiments. (d) Flow cytometry histograms depicting expression of mouse PD-L1 on EL4 (hCD19 mPD-L1) or ID8 cells. Data shown are representative of three independent experiments. (e) 4-h 51Cr release assay demonstrating lysis of tumor cells. Data shown are representative of three independent experiments. (f) All four CAR constructs produce antigen-specific IFN-γ after co-culture with tumor cells. Data shown are mean ± s.e.m. from four independent experiments. (g) Quantification of PD-1 detection on CAR-T cells, as measured by flow cytometry. Data shown is mean ± s.e.m. from four independent experiments, *P = 0.011 by two-tailed paired t test. (h) Experimental schematic and quantification of decreased PD-1 detection by flow cytometry on 4H11m28mZ T cells when cultured in a transwell plate with 19m28mZ or 19m28mZ/RMP1-14 T cells. Data shown are mean ± s.e.m. from five separate donors, *P = 0.012 by two-tailed paired t test.
Figure 1: Mouse CAR-T cells can be co-modified to secrete the mouse PD-1-blocking scFv RMP1-14. P2A linker CD19-targeted 19m28mZ CAR For ScFv detection Signal Peptide Variable light sequence Ovarian MUC16ecto-targeted 4H11m28mZ CAR Serine Glysine Linker Variable heavy sequence Armored mouse CAR constructs Second generation CAR construct A c-myc-tagged scFv derived from variable heavy and light chains from the anti-mouse PD-1-blocking monoclonal antibody (mAb), RMP1-14 T cell Signalling domain Binding domain Fig. 1a) Schematic of the bi-cistronic vectors used for syngeneic mouse studies encoding the CD19-targeted 19m28mZ CAR or ovarian MUC16ecto-targeted 4H11m28mZ CAR, linked with a P2A element to the secretable PD-1-blocking scFv RMP1-14. A c-myc-tag is included for detection of the scFv. Fig. 1c) Western blot on supernatant from equivalent numbers of viral packaging cells transduced to express the secretablescFvs with the CAR, detected with anti-myc-tag antibody. Data shown are representative of three independent experiments Transduced primary mouse T cells to express the CAR constructs Flow cytometry plot Conventional CARs Armored mouse CAR constructs Fig. 1b) Representative flow cytometry plot demonstrating CAR expression following mouse T cell transduction, detected with fluorescently labeled CAR-specific idiotypic antibodies. Data shown are representative of 3 independent experiments. Western blot analysis Armored mouse CAR constructs Supplementary Figure 1a Entire western blot of analysis shown in Figure 1c on supernatant from equivalent numbers of viral packaging cells transduced to express the secretablescFv with the CAR, detected with anti-myc-tag antibody. Data shown is representative of 3 independent experiments.
Figure 1 Mouse CAR-T cells can be co-modified to secrete the mouse PD-1-blocking scFv RMP1-14. (a) Schematic of the bi-cistronic vectors used for syngeneic mouse studies encoding the CD19-targeted 19m28mZ CAR or ovarian MUC16ecto-targeted 4H11m28mZ CAR, linked with a P2A element to the secretable PD-1-blocking scFv RMP1-14. A c-myc-tag is included for detection of the scFv. (b) Representative flow cytometry plot demonstrating CAR expression following mouse T cell transduction, detected with fluorescently labeled CAR-specific idiotypic antibodies. Data shown are representative of 3 independent experiments. (c) Western blot on supernatant from equivalent numbers of viral packaging cells transduced to express the secretablescFvs with the CAR, detected with anti-myc-tag antibody. Data shown are representative of three independent experiments. (d) Flow cytometry histograms depicting expression of mouse PD-L1 on EL4 (hCD19 mPD-L1) or ID8 cells. Data shown are representative of three independent experiments. (e) 4-h 51Cr release assay demonstrating lysis of tumor cells. Data shown are representative of three independent experiments. (f) All four CAR constructs produce antigen-specific IFN-γ after co-culture with tumor cells. Data shown are mean ± s.e.m. from four independent experiments. (g) Quantification of PD-1 detection on CAR-T cells, as measured by flow cytometry. Data shown is mean ± s.e.m. from four independent experiments, *P = 0.011 by two-tailed paired t test. (h) Experimental schematic and quantification of decreased PD-1 detection by flow cytometry on 4H11m28mZ T cells when cultured in a transwell plate with 19m28mZ or 19m28mZ/RMP1-14 T cells. Data shown are mean ± s.e.m. from five separate donors, *P = 0.012 by two-tailed paired t test.
Figure 1: Mouse CAR-T cells can be co-modified to secrete the mouse PD-1-blocking scFv RMP1-14. (cont.) Co-cultured scFv-secreting CAR-T cells with human CD19- expressing mouse lymphoma EL4 cells (hCD19 mPD-L1) or MUC16ecto-expressing ovarian tumor ID8 cells, which upregulate PD-L1 after exposure to IFN-γ Fig. 1d) Flow cytometry histograms depicting expression of mouse PD-L1 on EL4 (hCD19 mPD-L1) or ID8 cells. Data shown are representative of three independent experiments. Conventional and RMP1-14 scFv-secreting CAR-T cells specifically lysed Produced IFN-when cultured with tumor targets. Fig. 1e) 4-h 51Cr release assay demonstrating lysis of tumor cells. Data shown are representative of three independent experiments. Fig. 1f) All four CAR constructs produce antigen-specific IFN-γ after co-culture with tumor cells. Data shown are mean ± s.e.m. from four independent experiments.
Figure 1 Mouse CAR-T cells can be co-modified to secrete the mouse PD-1-blocking scFv RMP1-14. (a) Schematic of the bi-cistronic vectors used for syngeneic mouse studies encoding the CD19-targeted 19m28mZ CAR or ovarian MUC16ecto-targeted 4H11m28mZ CAR, linked with a P2A element to the secretable PD-1-blocking scFv RMP1-14. A c-myc-tag is included for detection of the scFv. (b) Representative flow cytometry plot demonstrating CAR expression following mouse T cell transduction, detected with fluorescently labeled CAR-specific idiotypic antibodies. Data shown are representative of 3 independent experiments. (c) Western blot on supernatant from equivalent numbers of viral packaging cells transduced to express the secretablescFvs with the CAR, detected with anti-myc-tag antibody. Data shown are representative of three independent experiments. (d) Flow cytometry histograms depicting expression of mouse PD-L1 on EL4 (hCD19 mPD-L1) or ID8 cells. Data shown are representative of three independent experiments. (e) 4-h 51Cr release assay demonstrating lysis of tumor cells. Data shown are representative of three independent experiments. (f) All four CAR constructs produce antigen-specific IFN-γ after co-culture with tumor cells. Data shown are mean ± s.e.m. from four independent experiments. (g) Quantification of PD-1 detection on CAR-T cells, as measured by flow cytometry. Data shown is mean ± s.e.m. from four independent experiments, *P = 0.011 by two-tailed paired t test. (h) Experimental schematic and quantification of decreased PD-1 detection by flow cytometry on 4H11m28mZ T cells when cultured in a transwell plate with 19m28mZ or 19m28mZ/RMP1-14 T cells. Data shown are mean ± s.e.m. from five separate donors, *P = 0.012 by two-tailed paired t test.
Figure 1: Mouse CAR-T cells can be co-modified to secrete the mouse PD-1-blocking scFv RMP1-14. (cont.) Evaluated the binding of secreted RMP1-14 scFvs to PD-1 Fig. 1g) Quantification of PD-1 detection on CAR-T cells, as measured by flow cytometry. Data shown is mean ± s.e.m. from four independent experiments, *P = 0.011 by two-tailed paired t test. Significant decrease in the amount of surface PD-1 on 19m28mZ/RMP1-14 T cells compared with cells modified to express 19m28mZ consistent with the scFvs binding in an autocrine manner to secreting CAR-T cells To determine whether scFvs bind to bystander PD-1 expressing cells, we co-cultured 4H11m28mZ T cells in the bottom well of a transwell plate with either 19m28mZ or 19m28mZ/RMP1-14 cells on top. After 24 h, we detected lower levels of PD-1 on the surface of 4H11m28mZ cells cultured with 19m28mZ/RMP1-14 cells than on those cultured with 19m28mZ T cells (P = 0.04), consistent with the binding of secreted scFvs to bystander cells. Fig. 1h) Experimental schematic and quantification of decreased PD-1 detection by flow cytometry on 4H11m28mZ T cells when cultured in a transwell plate with 19m28mZ or 19m28mZ/RMP1-14 T cells. Data shown are mean ± s.e.m. from five separate donors, *P = 0.012 by two-tailed paired t test. Supplementary Figure 1b) Representative dot plot examples of flow cytometric data quantifying PD-1 detected on CAR-T cells in Figure 1g. Data shown is representative from 4 independent experiments.
Figure 2 CAR-T cells secreting RMP1-14 scFv have enhanced anti-tumor function in syngeneic mouse tumor models. (a) Schematic diagram of experimental setup to detect scFv secretion in vivo. C57BL/6 mice were inoculated with ID8 tumor, monitored until development of ascites and subsequently treated i.p. with 4H11m28mZ or 4H11m28mZ/RMP1-14 T cells. In vivo secretion of RMP1-14 scFv was detected by harvesting ascites from tumor-bearing mice 48 h later. (b,c) The ascites was immunoprecipitated with an anti-myc-tag antibody and run on a western blot using an anti-myc tag antibody (b) or run on Luminex using anti-myc-tag beads (c, *P < 0.0004 using an two-tailed unpaired t test, mean ± s.e.m. = 2.3 ± 1.9 and 26 ± 1.2 for 4H11m28mZ and 4H11m28mZ/RMP1-14, respectively), Data shown are from two independent experiments. (d) C57BL/6 mice were injected i.p. with ID8 tumor cells and treated with CAR-T cells, 250 µg RMP1-14 mAb or a combination of both 7 d later. RMP1-14 mAb was given on days 3, 7 and 14 post-tumor inoculation (*P = 0.004 by Log-rank Mantel–Cox Test, with a 95% confidence interval (CI) of 0.4–0.9). Data shown are from two independent experiments. (e) PCR of bone marrow from mice surviving >120 d since tumor inoculation (d). CAR-T cells were detected in the bone marrow of long-term surviving mice treated with 4H11m28mZ T cells and RMP1-14 mAb or 4H11m28mZ/RMP1-14 T cells. Data shown are from two independent experiments. (f) C57BL/6 mice were inoculated with ID8 tumor and treated 7 d later with 4H11m28mZ or 4H11m28mZ/RMP1-14 T cells. Long-term surviving mice in the 4H11m28mZ/RMP1-14 T cell cohort were re-challenged with a second inoculation of ID8 cells and compared with naive untreated ID8-innoculated mice (*P = 0.007 by Log-rank Mantel-Cox Test, with a 95% CI of 0.2–0.3). (g) Quantification of flow cytometric analysis demonstrating that endogenous, CAR-T cells extracted from C57BL/6 mice bearing B16-F10 mouse melanoma and treated with PD-1-blocking scFv CAR-T cells had enhanced activation and cytokines levels compared with mice treated with second-generation CAR-T cells (P values indicated on figure, two-tailed unpaired t test). Data shown are pooled from six mice and two independent experiments.
Figure 2 : CAR-T cells secreting RMP1-14 scFv have enhanced anti-tumor function in syngeneic mouse tumor models. PD-1-blocking scFvs are secreted by CAR-T cells in vivo Fig. 2a) Schematic diagram of experimental setup to detect scFv secretion in vivo. C57BL/6 mice were inoculated with ID8 tumor, monitored until development of ascites and subsequently treated i.p. with 4H11m28mZ or 4H11m28mZ/RMP1-14 T cells. In vivo secretion of RMP1-14 scFv was detected by harvesting ascites from tumor-bearing mice 48 h later. (b,c) The ascites was immunoprecipitated with an anti-myc-tag antibody and run on a western blot using an anti-myc tag antibody Validated the presence of PD-1-blocking scFvs secreted by CAR-T cells in the TME. Tumor-bearing mice with palpable ascites were injected intraperitoneally (i.p.). with CAR-T cells Fig. 2b) or run on Luminex using anti-myc-tag beads Ascites from these mice was harvested 48 h later (Fig. 2b,c) The ascites was immunoprecipitated with an anti-myc-tag antibody and run on a western blot using an anti-myc tag antibody 26 ± 1.2 2.3± 1.9 Quantitate Screen Fig. 2c) *P < 0.0004 using an two-tailed unpaired t test, mean ± s.e.m. = 2.3 ± 1.9 and 26 ± 1.2 for 4H11m28mZ and 4H11m28mZ/RMP1-14, respectively), Data shown are from two independent experiments. Supplementary Figure 2 - Detection of scFv secreted by CAR-T cells in vivo. - Entire western blot from Figure 2b analysis of in vivo secretion of RMP1-14 scFv, detected by harvesting ascites from CAR-T cell treated, tumor-bearing mice after immunoprecipitation with an anti-myc-tag antibody.
Figure 2 CAR-T cells secreting RMP1-14 scFv have enhanced anti-tumor function in syngeneic mouse tumor models. (a) Schematic diagram of experimental setup to detect scFv secretion in vivo. C57BL/6 mice were inoculated with ID8 tumor, monitored until development of ascites and subsequently treated i.p. with 4H11m28mZ or 4H11m28mZ/RMP1-14 T cells. In vivo secretion of RMP1-14 scFv was detected by harvesting ascites from tumor-bearing mice 48 h later. (b,c) The ascites was immunoprecipitated with an anti-myc-tag antibody and run on a western blot using an anti-myc tag antibody (b) or run on Luminex using anti-myc-tag beads (c, *P < 0.0004 using an two-tailed unpaired t test, mean ± s.e.m. = 2.3 ± 1.9 and 26 ± 1.2 for 4H11m28mZ and 4H11m28mZ/RMP1-14, respectively), Data shown are from two independent experiments. (d) C57BL/6 mice were injected i.p. with ID8 tumor cells and treated with CAR-T cells, 250 µg RMP1-14 mAb or a combination of both 7 d later. RMP1-14 mAb was given on days 3, 7 and 14 post-tumor inoculation (*P = 0.004 by Log-rank Mantel–Cox Test, with a 95% confidence interval (CI) of 0.4–0.9). Data shown are from two independent experiments. (e) PCR of bone marrow from mice surviving >120 d since tumor inoculation (d). CAR-T cells were detected in the bone marrow of long-term surviving mice treated with 4H11m28mZ T cells and RMP1-14 mAb or 4H11m28mZ/RMP1-14 T cells. Data shown are from two independent experiments. (f) C57BL/6 mice were inoculated with ID8 tumor and treated 7 d later with 4H11m28mZ or 4H11m28mZ/RMP1-14 T cells. Long-term surviving mice in the 4H11m28mZ/RMP1-14 T cell cohort were re-challenged with a second inoculation of ID8 cells and compared with naive untreated ID8-innoculated mice (*P = 0.007 by Log-rank Mantel-Cox Test, with a 95% CI of 0.2–0.3). (g) Quantification of flow cytometric analysis demonstrating that endogenous, CAR-T cells extracted from C57BL/6 mice bearing B16-F10 mouse melanoma and treated with PD-1-blocking scFv CAR-T cells had enhanced activation and cytokines levels compared with mice treated with second-generation CAR-T cells (P values indicated on figure, two-tailed unpaired t test). Data shown are pooled from six mice and two independent experiments.
Figure 2 : CAR-T cells secreting RMP1-14 scFv have enhanced anti-tumor function in syngeneic mouse tumor models. (cont.) Tested the efficacy of scFv-secreting CAR-T cells in a syngeneic, immune-competent mouse model of metastatic ovarian carcinoma. C57BL/6 mice were injected i.p. with ID8 cells and treated 7 d later with CAR-T cells 4H11m28mZ T cells + RMP1-14 antibody enhance survive Fig. 2d) C57BL/6 mice were injected i.p. with ID8 tumor cells and treated with CAR-T cells, 250 μg RMP1-14 mAb or a combination of both 7 d later. RMP1-14 mAb was given on days 3, 7 and 14 post-tumor inoculation (*P = 0.004 by Log-rank Mantel–Cox Test, with a 95% confidence interval (CI) of 0.4–0.9). Data shown are from two independent experiments. 4H11m28mZ/RMP1-14 T showed enhanced survival Tumor-bearing mice treated with RMP1-14 mAb alone had no survival benefit over mice treated with control CAR-T cells. Fig. 2e) PCR of bone marrow from mice surviving >120 d since tumor inoculation (d). CAR-T cells were detected in the bone marrow of long-term surviving mice treated with 4H11m28mZ T cells and RMP1-14 mAb or 4H11m28mZ/RMP1-14 T cells. Data shown are from two independent experiments. T cell control PD-1 binding to PD-L1 can result in T cell exhaustion, energy and/or apoptosis. Long-term surviving mice treated with 4H11m28mZ/RMP1-14 T cells or 4H11m28mZ T cells + RMP1-14 antibody had detectable CAR-T cells by PCR in the bone marrow over 120 d post-tumor inoculation 4H11m28mZ/ RMP1-14 treated mice were able to mount an anti-tumor response when re-challenged with the initial dose of ID8 tumor cells (P < 0.0001), as compared with naive untreated mice. Fig. 2f) C57BL/6 mice were inoculated with ID8 tumor and treated 7 d later with 4H11m28mZ or 4H11m28mZ/RMP1-14 T cells. Long-term surviving mice in the 4H11m28mZ/RMP1-14 T cell cohort were re-challenged with a second inoculation of ID8 cells and compared with naive untreated ID8-innoculated mice (*P = 0.007 by Log-rank Mantel-Cox Test, with a 95% CI of 0.2–0.3).
Figure 2 CAR-T cells secreting RMP1-14 scFv have enhanced anti-tumor function in syngeneic mouse tumor models. (a) Schematic diagram of experimental setup to detect scFv secretion in vivo. C57BL/6 mice were inoculated with ID8 tumor, monitored until development of ascites and subsequently treated i.p. with 4H11m28mZ or 4H11m28mZ/RMP1-14 T cells. In vivo secretion of RMP1-14 scFv was detected by harvesting ascites from tumor-bearing mice 48 h later. (b,c) The ascites was immunoprecipitated with an anti-myc-tag antibody and run on a western blot using an anti-myc tag antibody (b) or run on Luminex using anti-myc-tag beads (c, *P < 0.0004 using an two-tailed unpaired t test, mean ± s.e.m. = 2.3 ± 1.9 and 26 ± 1.2 for 4H11m28mZ and 4H11m28mZ/RMP1-14, respectively), Data shown are from two independent experiments. (d) C57BL/6 mice were injected i.p. with ID8 tumor cells and treated with CAR-T cells, 250 µg RMP1-14 mAb or a combination of both 7 d later. RMP1-14 mAb was given on days 3, 7 and 14 post-tumor inoculation (*P = 0.004 by Log-rank Mantel–Cox Test, with a 95% confidence interval (CI) of 0.4–0.9). Data shown are from two independent experiments. (e) PCR of bone marrow from mice surviving >120 d since tumor inoculation (d). CAR-T cells were detected in the bone marrow of long-term surviving mice treated with 4H11m28mZ T cells and RMP1-14 mAb or 4H11m28mZ/RMP1-14 T cells. Data shown are from two independent experiments. (f) C57BL/6 mice were inoculated with ID8 tumor and treated 7 d later with 4H11m28mZ or 4H11m28mZ/RMP1-14 T cells. Long-term surviving mice in the 4H11m28mZ/RMP1-14 T cell cohort were re-challenged with a second inoculation of ID8 cells and compared with naive untreated ID8-innoculated mice (*P = 0.007 by Log-rank Mantel-Cox Test, with a 95% CI of 0.2–0.3). (g) Quantification of flow cytometric analysis demonstrating that endogenous, CAR-T cells extracted from C57BL/6 mice bearing B16-F10 mouse melanoma and treated with PD-1-blocking scFv CAR-T cells had enhanced activation and cytokines levels compared with mice treated with second-generation CAR-T cells (P values indicated on figure, two-tailed unpaired t test). Data shown are pooled from six mice and two independent experiments.
Figure 2 : CAR-T cells secreting RMP1-14 scFv have enhanced anti-tumor function in syngeneic mouse tumor models. (cont.) To test this, we injected C57BL/6 mice subcutaneously (s.c.) with the immunogenic melanoma cell line B16-F10. These mice mount an endogenous response to the tumor but cannot eradicate it Hypothesized that CAR-T cells secreting PD-1-blocking scFvs could re-invigorate endogenous tumor-specific T cells. Endogenous bystander tumor-infiltrating lymphocytes isolated from mice treated intratumorally with 4H11m28mZ/RMP1-14 CAR-T cells expressed significantly higher levels of CD80, CD107, IFN- and granzyme B than those treated with 4H11m28mZ (P < 0.05). Fig. 2g) Quantification of flow cytometric analysis demonstrating that endogenous, CAR-T cells extracted from C57BL/6 mice bearing B16-F10 mouse melanoma and treated with PD-1-blocking scFv CAR-T cells had enhanced activation and cytokines levels compared with mice treated with second-generation CAR-T cells (P values indicated on figure, two-tailed unpaired t test). Data shown are pooled from six mice and two independent experiments. Supplementary Figure 3 (a-b) Endogenous, CAR--T cells extracted from C57BL/6 mice bearing B16-F10 mouse melanoma and treated with PD-1-blocking scFv CAR-T cells have enhanced activation and cytokine levels as compared to mice treated with second generation CAR-T cells. (a-b) Representative plots demonstrating gating strategy utilized for flow cytometric quantification of CAR-T cells in Figure 2g. Data shown is representative of 2 independent experiments with 3 mice per condition, per experiment.
Figure 3 Human CAR-T cells can be co-modified to secrete a PD-1-blocking scFv, E27. (a) Human PD-1-blocking mAb candidates E27, E26 and E23 were used in a competitive binding assay to detect the interruption of PD-1 binding to PD-L1 at varying concentrations, as compared with a human IgG1 isotype control mAb (control). Data shown represent the mean of three independent experiments. (b) Schematic representation of PD-1-blocking scFv designed from the E23, E26 and E27 mAbs. The signal peptide was linked to the variable heavy sequence, serine glycine linker and the variable light chain sequence. The His/HA tag was included for detection of the scFv. (c) Western blot on supernatant from equivalent numbers of 293-Glv9 packaging cells transduced to secrete scFvs with the 1928z CAR, stained with anti-HA antibody. Data shown are representative of two independent experiments. (d) Schematic of the bi-cistronic vector encoding the CD19-targeted 1928z CAR or ovarian MUC16ecto-targeted 4H1128z CAR, linked with a P2A element to the secretable anti-human PD-1-blocking scFv E27. (e) Representative flow cytometry plot demonstrating CAR expression following donor human T cell transduction, detected with fluorescently labeled CAR-specific idiotypic antibodies. Data shown are representative of 3 independent experiments. (f) Western blot on supernatant from CAR-T cells stained with anti-HA mAb, demonstrating a ~30-kDa protein in the 1928z-E27 and 4H1128z-E27 T cells. Data shown are representative of two independent experiments. (g) Western blot analysis of 293Glv9-PD-1+ cells incubated in supernatant from 1928z and 1928z-E27 T cells, stained with anti-HA mAb, showing a ~30-kDa protein in the PD-1+ cells incubated with supernatant from 1928z-E27. Data shown is representative of two independent experiments. (h) Quantification of PD-1 detection by flow cytometry on 1928z-E27 and 4H1128z-E27 T cells, as compared to second-generation CAR-T cells. Data shown is mean ± s.e.m. from five independent donors. For comparison of 1928z to 1928z-E27, *P = 0.05; 4H1128z to 4H1128z-E27, **P = 0.006; both by a two-tailed paired t test. (i) 4-h 51Cr release assay demonstrating that all four CAR constructs had antigen-dependent lysis of tumor cells. Data shown are representative of three independent donors and experiments.
Figure 3: Human CAR-T cells can be co-modified to secrete a PD-1-blocking scFv, E27. Selection of human PD-1-blocking scFv E27 The human PD-1-blocking scFvs E23, E26 and E27 were isolated from a human scFv phage display library (Eureka Therapeutics). The dissociation constants (KD) for the three lead candidates, E23, E26 and E27, binding to PD-1 were 8.3, 6.3 and 3.6 nM, respectively. Fig. 3a) Human PD-1-blocking mAb candidates E27, E26 and E23 were used in a competitive binding assay to detect the interruption of PD-1 binding to PD-L1 at varying concentrations, as compared with a human IgG1 isotype control mAb (control). Data shown represent the mean of three independent experiments Fig. 3c) Western blot on supernatant from equivalent numbers of 293-Glv9 packaging cells transduced to secrete scFvs with the 1928z CAR, stained with anti-HA antibody. Data shown are representative of two independent experiments. Fig. 3b) Schematic representation of PD-1-blocking scFv designed from the E23, E26 and E27 mAbs. The signal peptide was linked to the variable heavy sequence, serine glycine linker and the variable light chain sequence. The His/HA tag was included for detection of the scFv. The E23, E26 and E27 antibodies were able to block PD-1 from binding to PD-L1 in a dose-dependent manner We collected supernatant from equivalent numbers of transduced viral producer cells and detected anti-PD1 secretablescFvs The most intense band was observed for clone E27, indicating that the scFv was the most stable in supernatant. For this reason, we used E27 in subsequent studies Supplementary Figure 4a Entire western blot from Figure 3c of analysis on supernatant from equivalent numbers of 293-Glv9 packaging cells transduced to secrete scFvs with the 1928z CAR, stained with anti-HA antibody. Data show is representative of 2 independent experiments.
Figure 3 Human CAR-T cells can be co-modified to secrete a PD-1-blocking scFv, E27. (a) Human PD-1-blocking mAb candidates E27, E26 and E23 were used in a competitive binding assay to detect the interruption of PD-1 binding to PD-L1 at varying concentrations, as compared with a human IgG1 isotype control mAb (control). Data shown represent the mean of three independent experiments. (b) Schematic representation of PD-1-blocking scFv designed from the E23, E26 and E27 mAbs. The signal peptide was linked to the variable heavy sequence, serine glycine linker and the variable light chain sequence. The His/HA tag was included for detection of the scFv. (c) Western blot on supernatant from equivalent numbers of 293-Glv9 packaging cells transduced to secrete scFvs with the 1928z CAR, stained with anti-HA antibody. Data shown are representative of two independent experiments. (d) Schematic of the bi-cistronic vector encoding the CD19-targeted 1928z CAR or ovarian MUC16ecto-targeted 4H1128z CAR, linked with a P2A element to the secretable anti-human PD-1-blocking scFv E27. (e) Representative flow cytometry plot demonstrating CAR expression following donor human T cell transduction, detected with fluorescently labeled CAR-specific idiotypic antibodies. Data shown are representative of 3 independent experiments. (f) Western blot on supernatant from CAR-T cells stained with anti-HA mAb, demonstrating a ~30-kDa protein in the 1928z-E27 and 4H1128z-E27 T cells. Data shown are representative of two independent experiments. (g) Western blot analysis of 293Glv9-PD-1+ cells incubated in supernatant from 1928z and 1928z-E27 T cells, stained with anti-HA mAb, showing a ~30-kDa protein in the PD-1+ cells incubated with supernatant from 1928z-E27. Data shown is representative of two independent experiments. (h) Quantification of PD-1 detection by flow cytometry on 1928z-E27 and 4H1128z-E27 T cells, as compared to second-generation CAR-T cells. Data shown is mean ± s.e.m. from five independent donors. For comparison of 1928z to 1928z-E27, *P = 0.05; 4H1128z to 4H1128z-E27, **P = 0.006; both by a two-tailed paired t test. (i) 4-h 51Cr release assay demonstrating that all four CAR constructs had antigen-dependent lysis of tumor cells. Data shown are representative of three independent donors and experiments.
Figure 3: Human CAR-T cells can be co-modified to secrete a PD-1-blocking scFv, E27. (Cont.) Modification of human CAR-T cells to secrete an anti-human PD-1-blocking scFv Transduced T cells expressed CAR on the surface Generated human CAR constructs encoding the CD19- or MUC16ecto-targeted CAR and the His/HA-tagged E27 scFv (1928z-E27 and 4H1128z-E27, respectively) secreted E27 scFv Fig. 3d) Schematic of the bi-cistronic vector encoding the CD19-targeted 1928z CAR or ovarian MUC16ecto-targeted 4H1128z CAR, linked with a P2A element to the secretable anti-human PD-1-blocking scFv E27. Supplementary Figure 4b Entire western blot from Figure 3f on supernatant from CAR-T cells stained with anti-HA mAb, demonstrating a ~30 kDa protein in the 1928z-E27 and 4H1128z-E27 T cells. Data shown is representative of 2 independent experiments. Binding of E27 to PD-1 was demonstrated by HA-tag detection on 293Glv9-PD1+ cells after incubation in supernatant from 1928z-E27 T cells Fig. 3e) Representative flow cytometry plot demonstrating CAR expression following donor human T cell transduction, detected with fluorescently labeled CAR-specific idiotypic antibodies. Data shown are representative of 3 independent experiments. Fig. 3f) Western blot on supernatant from CAR-T cells stained with anti-HA mAb, demonstrating a ∼30-kDa protein in the 1928z-E27 and 4H1128z-E27 T cells. Data shown are representative of two independent experiments. Supplementary Figure 4c Entire western blot from Figure 3g of 293-Glv9-PD-1+ cells incubated in supernatant (SN) from 1928z and 1928z-E27 T cells, stained with anti-HA mAb, showing a ~30 kDa protein in the PD-1+ cells incubated with supernatant from 1928z-E27. Data shown is representative of 2 independent experiments. Fig. 3g) Western blot analysis of 293Glv9-PD-1+ cells incubated in supernatant from 1928z and 1928z-E27 T cells, stained with anti-HA mAb, showing a ∼30-kDa protein in the PD-1+ cells incubated with supernatant from 1928z-E27. Data shown is representative of two independent experiments.
Figure 3 Human CAR-T cells can be co-modified to secrete a PD-1-blocking scFv, E27. (a) Human PD-1-blocking mAb candidates E27, E26 and E23 were used in a competitive binding assay to detect the interruption of PD-1 binding to PD-L1 at varying concentrations, as compared with a human IgG1 isotype control mAb (control). Data shown represent the mean of three independent experiments. (b) Schematic representation of PD-1-blocking scFv designed from the E23, E26 and E27 mAbs. The signal peptide was linked to the variable heavy sequence, serine glycine linker and the variable light chain sequence. The His/HA tag was included for detection of the scFv. (c) Western blot on supernatant from equivalent numbers of 293-Glv9 packaging cells transduced to secrete scFvs with the 1928z CAR, stained with anti-HA antibody. Data shown are representative of two independent experiments. (d) Schematic of the bi-cistronic vector encoding the CD19-targeted 1928z CAR or ovarian MUC16ecto-targeted 4H1128z CAR, linked with a P2A element to the secretable anti-human PD-1-blocking scFv E27. (e) Representative flow cytometry plot demonstrating CAR expression following donor human T cell transduction, detected with fluorescently labeled CAR-specific idiotypic antibodies. Data shown are representative of 3 independent experiments. (f) Western blot on supernatant from CAR-T cells stained with anti-HA mAb, demonstrating a ~30-kDa protein in the 1928z-E27 and 4H1128z-E27 T cells. Data shown are representative of two independent experiments. (g) Western blot analysis of 293Glv9-PD-1+ cells incubated in supernatant from 1928z and 1928z-E27 T cells, stained with anti-HA mAb, showing a ~30-kDa protein in the PD-1+ cells incubated with supernatant from 1928z-E27. Data shown is representative of two independent experiments. (h) Quantification of PD-1 detection by flow cytometry on 1928z-E27 and 4H1128z-E27 T cells, as compared to second-generation CAR-T cells. Data shown is mean ± s.e.m. from five independent donors. For comparison of 1928z to 1928z-E27, *P = 0.05; 4H1128z to 4H1128z-E27, **P = 0.006; both by a two-tailed paired t test. (i) 4-h 51Cr release assay demonstrating that all four CAR constructs had antigen-dependent lysis of tumor cells. Data shown are representative of three independent donors and experiments.
Figure 3: Human CAR-T cells can be co-modified to secrete a PD-1-blocking scFv, E27. (Cont.) We detected less PD-1 on 1928z-E27 and 4H1128z- E27 T cells than on cells modified to express 1928z or 4H1128z, consistent with the binding of E27 scFv to T cell PD-1 Corroborated antigen-dependent lysis by CAR-T cells in the context of tumor cells Fig. 3i) 4-h 51Cr release assay demonstrating that all four CAR constructs had antigen-dependent lysis of tumor cells. Data shown are representative of three independent donors and experiments. Supplementary Figure 4d Representative dot plot from Figure 3h, showing decreased PD-1 detection by flow cytometry on 1928z-E27 and 4H1128z-E27 T cell, as compared to second-generation CAR-T cells. Data shown is representative of 5 independent donors. Fig. 3h) Quantification of PD-1 detection by flow cytometry on 1928z-E27 and 4H1128z-E27 T cells, as compared to second-generation CAR-T cells. Data shown is mean ± s.e.m. from five independent donors. For comparison of 1928z to 1928z-E27, *P = 0.05; 4H1128z to 4H1128z-E27, **P = 0.006; both by a two-tailed paired t test.
Figure 4 Coexpression of CAR and E27 scFv protects proliferative and lytic capacity of T cells in the context of PD-L1+ tumor cells. (a) Representative flow cytometry dot plots demonstrating lysis of Raji-PDL1 tumor cells following 72 h co-culture. Data shown are representative of three independent donors and experiments. (b) 1928z-E27 T cells lysed significantly more Raji-PDL1 tumor cells than 1928z T cells. Data shown represent the mean ± s.e.m. from five independent experiments, *P = 0.03 by a one-tailed paired t test. (c) CAR-T cells expansion numbers following co-culture with Raji-PDL1 or NALM6-PDL1 tumor cells as determined by flow cytometry. Data shown are the average total number of T cells ± s.e.m. from four independent experiments, *P = 0.05 for Raji experiment and **P = 0.02 for NALM6 experiment, both by a two-tailed paired t test. (d,e) Representative flow cytometry plot (d) and quantification (e) showing increased PD-1 detection on 1928z T cells compared with 1928z-E27 T cells following 7 d co-culture with Raji-PDL1 tumor cells. Data shown are the mean ± s.e.m. from three independent experiments. *P = 0.03 for percent positive CAR-T cell and MFI of staining, both by two-tailed paired test. (f) 1928z and 1928z-E27 T cells were co-cultured with human T cells transduced to overexpress PD-1, stimulated with CD3/CD28 beads after 4d and sorted by flow cytometry to separate CAR+ and CAR− cells. Western blot was performed on the sorted populations and probed with anti-HA mAb. Data shown are representative of three independent donors and experiments. (g) Representative example of 1928z and 1928z-E27 T cells fold expansion when cultured with 3T3-empty or 3T3-PDL1 cells and stimulated with anti-CD3 and anti-CD28 beads. Data shown are representative of three independent donors and experiments. (h) Cells were enumerated and re-plated on new 3T3 cells on days 3, 6, 9 and 12. 1928z T cells had reduced expansion when cultured with 3T3-PDL1 cells compared with 3T3-empty cells. 1928z-E27 cells had equivalent expansion when cultured with 3T3-empty or 3T3-PDL1 cells. Data shown are the mean fold expansion ± s.e.m. from four independent experiments, *P < 0.05 by two-tailed paired t test. (i) Expansion of 1928z-E27 T cells on 3T3-PDL1 cells was due to an increase in both CAR+ and CAR− cells, comparing populations on day 0 and following expansion on 3T3-PDL1 cells on day 12. Data shown are representative of three independent experiments.
Figure 4: Coexpression of CAR and E27 scFv protects proliferative and lytic capacity of T cells in the context of PD-L1+ tumor cells. We transduced Raji and NALM6 tumor cells to express PD-L1 and co-cultured 1928z and 1928z-E27 T with either Raji-PD-L1 or NALM6-PD-L1 tumor at 1:1 tumor:CAR-T cell ratio. After 72 h of co-culture, we used flow cytometry to detect the remaining tumor cells. 1928z-E27 T cells lysed more Raji-PDL1 and NALM6-PDL1 tumor cells than 1928z T cells. 1928z-E27 T cells lysed more Raji-PDL1 and NALM6-PDL1 tumor cells than 1928z T cells. Fig. 4c) CAR-T cells expansion numbers following co-culture with Raji-PDL1 or NALM6-PDL1 tumor cells as determined by flow cytometry. Data shown are the average total number of T cells ± s.e.m. from four independent experiments, *P = 0.05 for Raji experiment and **P = 0.02 for NALM6 experiment, both by a two-tailed paired t test. (d,e) Representative flow cytometry plot Fig. 4b) 1928z-E27 T cells lysed significantly more Raji-PDL1 tumor cells than 1928z T cells. Data shown represent the mean ± s.e.m. from five independent experiments, *P = 0.03 by a one-tailed paired t test. Fig.4a) Representative flow cytometry dot plots demonstrating lysis of Raji-PDL1 tumor cells following 72 h co-culture. Data shown are representative of three independent donors and experiments. We found increased expansion of 1928z-E27 T cells following co-culture with Raji-PDL1or NALM-PDL1 tumor compared with 1928z T cells consistent with 1928z-E27 T cell response to PD-L1-mediated suppression Following co-culture with Raji-PD-L1, 1928z-E27 cells showed lower levels of surface PD-1 detection than 1928z T cells, as determined by both the percentage of positive cells and the mean fluorescence intensity of the staining Fig. 4d) and quantification Fig. 4e) showing increased PD-1 detection on 1928z T cells compared with 1928z-E27 T cells following 7 d co-culture with Raji-PDL1 tumor cells. Data shown are the mean ± s.e.m. from three independent experiments. *P = 0.03 for percent positive CAR-T cell and MFI of staining, both by two-tailed paired test.
Figure 4 Coexpression of CAR and E27 scFv protects proliferative and lytic capacity of T cells in the context of PD-L1+ tumor cells. (a) Representative flow cytometry dot plots demonstrating lysis of Raji-PDL1 tumor cells following 72 h co-culture. Data shown are representative of three independent donors and experiments. (b) 1928z-E27 T cells lysed significantly more Raji-PDL1 tumor cells than 1928z T cells. Data shown represent the mean ± s.e.m. from five independent experiments, *P = 0.03 by a one-tailed paired t test. (c) CAR-T cells expansion numbers following co-culture with Raji-PDL1 or NALM6-PDL1 tumor cells as determined by flow cytometry. Data shown are the average total number of T cells ± s.e.m. from four independent experiments, *P = 0.05 for Raji experiment and **P = 0.02 for NALM6 experiment, both by a two-tailed paired t test. (d,e) Representative flow cytometry plot (d) and quantification (e) showing increased PD-1 detection on 1928z T cells compared with 1928z-E27 T cells following 7 d co-culture with Raji-PDL1 tumor cells. Data shown are the mean ± s.e.m. from three independent experiments. *P = 0.03 for percent positive CAR-T cell and MFI of staining, both by two-tailed paired test. (f) 1928z and 1928z-E27 T cells were co-cultured with human T cells transduced to overexpress PD-1, stimulated with CD3/CD28 beads after 4d and sorted by flow cytometry to separate CAR+ and CAR− cells. Western blot was performed on the sorted populations and probed with anti-HA mAb. Data shown are representative of three independent donors and experiments. (g) Representative example of 1928z and 1928z-E27 T cells fold expansion when cultured with 3T3-empty or 3T3-PDL1 cells and stimulated with anti-CD3 and anti-CD28 beads. Data shown are representative of three independent donors and experiments. (h) Cells were enumerated and re-plated on new 3T3 cells on days 3, 6, 9 and 12. 1928z T cells had reduced expansion when cultured with 3T3-PDL1 cells compared with 3T3-empty cells. 1928z-E27 cells had equivalent expansion when cultured with 3T3-empty or 3T3-PDL1 cells. Data shown are the mean fold expansion ± s.e.m. from four independent experiments, *P < 0.05 by two-tailed paired t test. (i) Expansion of 1928z-E27 T cells on 3T3-PDL1 cells was due to an increase in both CAR+ and CAR− cells, comparing populations on day 0 and following expansion on 3T3-PDL1 cells on day 12. Data shown are representative of three independent experiments.
Figure 4: Coexpression of CAR and E27 scFv protects proliferative and lytic capacity of T cells in the context of PD-L1+ tumor cells. (cont.) E27 binds to bystander cells We cultured 1928z and 1928z-E27 T cells with 3T3-empty or 3T3-PDL1 cells and stimulated them with anti-CD3 and anti-CD28 beads. To demonstrate that untransduced bystander cells can benefit from the E27 scFv secreted from nearby CAR-T cells, we first cocultured healthy human donor T cells with 1928z or 1928z-E27 CAR-T cells and stimulated the cells with anti-CD3 and anti- CD28 beads. After 4 d of co-culture, CAR+ and CAR− T cells were sorted and western blot analysis demonstrated E27 binding to PD-1 on both CAR+ and CAR− cells in the 1928z-E27/PD-1 T cell co-culture, but not the 1928z/PD-1 T-cell co-culture 1928z T cells that were cultured with 3T3-empty cells showed enhanced proliferation compared with 1928z T cells cultured with 3T3-PDL1cells Supplementary Figure 5 Western blot analysis of scFv binding to CAR- and CAR+ populations after co-culture. Entire western blot from Figure 4f showing western blot analysis on flow sorted CAR+ and CAR--T cell populations probed with anti-HA mAb. Fig. 4f) 1928z and 1928z-E27 T cells were co-cultured with human T cells transduced to overexpress PD-1, stimulated with CD3/CD28 beads after 4d and sorted by flow cytometry to separate CAR+ and CAR− cells. Western blot was performed on the sorted populations and probed with anti-HA mAb. Data shown are representative of three independent donors and experiments. Fig. 4g) Representative example of 1928z and 1928z-E27 T cells fold expansion when cultured with 3T3-empty or 3T3-PDL1 cells and stimulated with anti-CD3 and anti-CD28 beads. Data shown are representative of three independent donors and experiments.
Figure 4 Coexpression of CAR and E27 scFv protects proliferative and lytic capacity of T cells in the context of PD-L1+ tumor cells. (a) Representative flow cytometry dot plots demonstrating lysis of Raji-PDL1 tumor cells following 72 h co-culture. Data shown are representative of three independent donors and experiments. (b) 1928z-E27 T cells lysed significantly more Raji-PDL1 tumor cells than 1928z T cells. Data shown represent the mean ± s.e.m. from five independent experiments, *P = 0.03 by a one-tailed paired t test. (c) CAR-T cells expansion numbers following co-culture with Raji-PDL1 or NALM6-PDL1 tumor cells as determined by flow cytometry. Data shown are the average total number of T cells ± s.e.m. from four independent experiments, *P = 0.05 for Raji experiment and **P = 0.02 for NALM6 experiment, both by a two-tailed paired t test. (d,e) Representative flow cytometry plot (d) and quantification (e) showing increased PD-1 detection on 1928z T cells compared with 1928z-E27 T cells following 7 d co-culture with Raji-PDL1 tumor cells. Data shown are the mean ± s.e.m. from three independent experiments. *P = 0.03 for percent positive CAR-T cell and MFI of staining, both by two-tailed paired test. (f) 1928z and 1928z-E27 T cells were co-cultured with human T cells transduced to overexpress PD-1, stimulated with CD3/CD28 beads after 4d and sorted by flow cytometry to separate CAR+ and CAR− cells. Western blot was performed on the sorted populations and probed with anti-HA mAb. Data shown are representative of three independent donors and experiments. (g) Representative example of 1928z and 1928z-E27 T cells fold expansion when cultured with 3T3-empty or 3T3-PDL1 cells and stimulated with anti-CD3 and anti-CD28 beads. Data shown are representative of three independent donors and experiments. (h) Cells were enumerated and re-plated on new 3T3 cells on days 3, 6, 9 and 12. 1928z T cells had reduced expansion when cultured with 3T3-PDL1 cells compared with 3T3-empty cells. 1928z-E27 cells had equivalent expansion when cultured with 3T3-empty or 3T3-PDL1 cells. Data shown are the mean fold expansion ± s.e.m. from four independent experiments, *P < 0.05 by two-tailed paired t test. (i) Expansion of 1928z-E27 T cells on 3T3-PDL1 cells was due to an increase in both CAR+ and CAR− cells, comparing populations on day 0 and following expansion on 3T3-PDL1 cells on day 12. Data shown are representative of three independent experiments.
Figure 4: Coexpression of CAR and E27 scFv protects proliferative and lytic capacity of T cells in the context of PD-L1+ tumor cells. (cont.) By day 12, 1928z T cells cultured with 3T3-PDL1 cells had significantly decreased cell numbers compared with those cultured with 3T3-empty cells.We anticipated that the population of CAR+ and CAR− cells would contract in this condition in a similar ratio and that the overall CAR+ percentage would remain the same relative to time 0. This is what we observed when we calculated the CAR+ cells relative to time 0 1928z-E27 T cells showed similar expansion when cultured with 3T3-empty and 3T3-PDL1 cells There was no significant difference between the expansion of 1928z and 1928z-E27 T cells when cultured with 3T3-empty cells (P = 0.063). Fig. 4i) Expansion of 1928z-E27 T cells on 3T3-PDL1 cells was due to an increase in both CAR+ and CAR− cells, comparing populations on day 0 and following expansion on 3T3-PDL1 cells on day 12. Data shown are representative of three independent experiments. Fig. 4h) Cells were enumerated and re-plated on new 3T3 cells on days 3, 6, 9 and 12. 1928z T cells had reduced expansion when cultured with 3T3-PDL1 cells compared with 3T3-empty cells. 1928z-E27 cells had equivalent expansion when cultured with 3T3-empty or 3T3-PDL1 cells. Data shown are the mean fold expansion ± s.e.m. from four independent experiments, *P < 0.05 by two-tailed paired t test.
Figure 5 CAR-T cells that secrete E27 scFv have enhanced anti-tumor function in vivo. (a,b) SCID/Beige mice inoculated with Raji-PDL1 (a) or NALM6-PDL1 (b) tumor cells and treated with 1928z-E27 CAR-T cells have enhanced survival over mice treated with 1928z (P = 0.003 with 95% CI of 0.1–0.9 and P = 0.0004 with 95% CI of 0.02–0.3, respectively by log-rank Mantel–Cox test). Data shown are pooled from two independent experiments. (c) SCID/Beige mice treated with 4H1128z-E27 T cells had enhanced survival compared with mice treated with 4H1128z or antigen-irrelevant 1928z-E27 T cells in mice bearing SKOV3-PDL1 ovarian tumor cells. Data shown are from two independent experiments, P = 0.02 by log-rank Mantel–Cox test with a 95% CI of 0.2–1.5. (d) Survival curve showing mice treated with 4H1128z-E27 T cells had enhanced survival compared with mice treated with 4H1128z + anti-human PD-1 mAb. Data shown are from two independent experiments, P = 0.05 by log-rank Mantel–Cox test with a 95% CI of 0.4–3.1. (e) Schematic illustration of experiment to study bystander effect of scFv-secreting CAR-T cells in which SKOV3-PDL1 tumor-bearing mice were treated with a combination of E27-secreting 1928z T cells, which are antigen irrelevant in this model, together with ovarian-tumor specific 4H1128z T cells. PD-1-blocking scFv secreted by the 1928z-E27 T cells in vivo bound to PD-1 on 4H1128z T cells and enhanced tumor-specific function. (f) Mice treated 7 d after SKOV3-PDL1 inoculation with a mix of 1928z-E27 + 4H1128z T cells had enhanced survival compared with mice treated with 4H1128z (P = 0.007, 95% CI of 0.03–0.6) or 1928z-E27 (P < 0.0001, 95% CI of 0.02–0.2) T cells alone. Data shown are from two independent experiments.
Figure 5: CAR-T cells that secrete E27 scFv have enhanced anti-tumor function in vivo. CAR-T cells secreting E27 scFv have enhanced anti-tumor function in vivo We determined the in vivo anti-tumor efficacy of E27-secreting CART cells by inoculating SCID/Beige mice with Raji-PDL1 or NALM6-PDL1 tumor cells intravenously (i.v.) Fig. 5b) SCID/Beige mice inoculated with NALM6-PDL1 Fig. 5a) SCID/Beige mice inoculated with Raji-PDL1 Infusion of 1928z-E27 T cells significantly enhanced the survival of both Raji-PDL1 (P = 0.03; Fig. 5a) and NALM6-PDL1 (P = 0.01; Fig. 5b) tumor-bearing mice compared with an infusion of 1928z T cells. Figure 5b) tumor cells and treated with 1928z-E27 CAR-T cells have enhanced survival over mice treated with 1928z (P = 0.003 with 95% CI of 0.1–0.9 and P = 0.0004 with 95% CI of 0.02–0.3, respectively by log-rank Mantel–Cox test). Data shown are pooled from two independent experiments Fig. 5c) SCID/Beige mice treated with 4H1128z-E27 T cells had enhanced survival compared with mice treated with 4H1128z or antigen-irrelevant 1928z-E27 T cells in mice bearing SKOV3-PDL1 ovarian tumor cells. Data shown are from two independent experiments, P = 0.02 by log-rank Mantel–Cox test with a 95% CI of 0.2–1.5. Next, we investigated the anti-tumor efficacy of E27-secreting CART cells in a solid tumor model of peritoneal carcinomatosis. Preclinical xenograft model of metastatic ovarian tumor SKOV3-PDL1 tumor-bearing SCID/Beige mice treated with 4H1128z-E27 T cells showed enhanced survival compared with mice treated with 4H1128z T cells (P = 0.02). Fig. 5d) Survival curve showing mice treated with 4H1128z-E27 T cells had enhanced survival compared with mice treated with 4H1128z + anti-human PD-1 mAb. Data shown are from two independent experiments, P = 0.05 by log-rank Mantel–Cox test with a 95% CI of 0.4–3.1. Mice treated with E27 scFv-secreting 4H1128z T cells had enhanced survival benefit over mice treated with 4H1128z T cells + anti-human PD-1 mAb(P = 0.048).
Figure 5 CAR-T cells that secrete E27 scFv have enhanced anti-tumor function in vivo. (a,b) SCID/Beige mice inoculated with Raji-PDL1 (a) or NALM6-PDL1 (b) tumor cells and treated with 1928z-E27 CAR-T cells have enhanced survival over mice treated with 1928z (P = 0.003 with 95% CI of 0.1–0.9 and P = 0.0004 with 95% CI of 0.02–0.3, respectively by log-rank Mantel–Cox test). Data shown are pooled from two independent experiments. (c) SCID/Beige mice treated with 4H1128z-E27 T cells had enhanced survival compared with mice treated with 4H1128z or antigen-irrelevant 1928z-E27 T cells in mice bearing SKOV3-PDL1 ovarian tumor cells. Data shown are from two independent experiments, P = 0.02 by log-rank Mantel–Cox test with a 95% CI of 0.2–1.5. (d) Survival curve showing mice treated with 4H1128z-E27 T cells had enhanced survival compared with mice treated with 4H1128z + anti-human PD-1 mAb. Data shown are from two independent experiments, P = 0.05 by log-rank Mantel–Cox test with a 95% CI of 0.4–3.1. (e) Schematic illustration of experiment to study bystander effect of scFv-secreting CAR-T cells in which SKOV3-PDL1 tumor-bearing mice were treated with a combination of E27-secreting 1928z T cells, which are antigen irrelevant in this model, together with ovarian-tumor specific 4H1128z T cells. PD-1-blocking scFv secreted by the 1928z-E27 T cells in vivo bound to PD-1 on 4H1128z T cells and enhanced tumor-specific function. (f) Mice treated 7 d after SKOV3-PDL1 inoculation with a mix of 1928z-E27 + 4H1128z T cells had enhanced survival compared with mice treated with 4H1128z (P = 0.007, 95% CI of 0.03–0.6) or 1928z-E27 (P < 0.0001, 95% CI of 0.02–0.2) T cells alone. Data shown are from two independent experiments.
Figure 5: CAR-T cells that secrete E27 scFv have enhanced anti-tumor function in vivo. (Cont.) To demonstrate in vivo the bystander effect of the E27-secreting CAR-T cells, we treated SKOV3-PD-L1-bearing mice with a combination of antigen-irrelevant 1928z-E27 and tumor-specific 4H1128z CAR-T cells. In this experimental model, only the antigen-irrelevant CAR-T cells expressed the PD-1-blocking scFvs, and treatment with 1928z-E27 T cells alone had no survival benefit However, when injected together, 1928z-E27 enhanced the anti-tumor function of second-generation 4H1128z cells, as compared with mice treated with just 4H1128z T cells (P = 0.03). This result suggests that the E27 scFv secreted by the 1928z-E27 cells binds to bystander tumor-specific cells in vivo. Fig. 5e) Schematic illustration of experiment to study bystander effect of scFv-secreting CAR-T cells in which SKOV3-PDL1 tumor-bearing mice were treated with a combination of E27-secreting 1928z T cells, which are antigen irrelevant in this model, together with ovarian-tumor specific 4H1128z T cells. PD-1-blocking scFv secreted by the 1928z-E27 T cells in vivo bound to PD-1 on 4H1128z T cells and enhanced tumor-specific function. Fig. 5f) Mice treated 7 d after SKOV3-PDL1 inoculation with a mix of 1928z-E27 + 4H1128z T cells had enhanced survival compared with mice treated with 4H1128z (P = 0.007, 95% CI of 0.03–0.6) or 1928z-E27 (P < 0.0001, 95% CI of 0.02–0.2) T cells alone. Data shown are from two independent experiments.
Figure 6 The PD-1-blocking E27 scFv secreted by CAR-T cells is only detected in the local TME. (a) Imaging and quantification over time of E27 scFv tagged with GLuc or fluorescently labeled anti-human PD-1 mAb in SKOV3-PDL1 tumor-bearing SCID/Beige mice treated i.p. with scFv-secreting CAR-T cells or CAR-T cells with anti-PD-1 mAb (three animals per group). (b) Schematic representation and quantitation of areas used for complete versus local detection of scFv or antibody. *P < 0.02 at all time points tested for antibody using multiple t test with three animals per group. (c) Quantification using unique peptide sequences by liquid chromatography-tandem mass spectrometry (LC-MS/MS) of serum levels over time of E27 scFv and anti-human PD-1 mAb in SKOV3-PDL1 tumor-bearing SCID/Beige mice treated i.p. with scFv-secreting CAR-T cells or CAR-T cells with anti-PD-1 mAb (five animals per group). Systemic infusion of isolated E27 scFv was used as a positive control.
Figure 6 : The PD-1-blocking E27 scFv secreted by CAR-T cells is only detected in the local TME. E27 scFv secreted by CAR-T cells is only detected in the local TME Using the SKOV3 solid tumor model of peritoneal carcinomatosis, we sought to determine the local and systemic levels of CAR-secreted scFvs. Fig. 6a) Imaging and quantification over time of E27 scFv tagged with GLuc or fluorescently labeled anti-human PD-1 mAb in SKOV3-PDL1 tumor-bearing SCID/Beige mice treated i.p. with scFv-secreting CAR-T cells or CAR-T cells with anti-PD-1 mAb (three animals per group).
Figure 6 The PD-1-blocking E27 scFv secreted by CAR-T cells is only detected in the local TME. (a) Imaging and quantification over time of E27 scFv tagged with GLuc or fluorescently labeled anti-human PD-1 mAb in SKOV3-PDL1 tumor-bearing SCID/Beige mice treated i.p. with scFv-secreting CAR-T cells or CAR-T cells with anti-PD-1 mAb (three animals per group). (b) Schematic representation and quantitation of areas used for complete versus local detection of scFv or antibody. *P < 0.02 at all time points tested for antibody using multiple t test with three animals per group. (c) Quantification using unique peptide sequences by liquid chromatography-tandem mass spectrometry (LC-MS/MS) of serum levels over time of E27 scFv and anti-human PD-1 mAb in SKOV3-PDL1 tumor-bearing SCID/Beige mice treated i.p. with scFv-secreting CAR-T cells or CAR-T cells with anti-PD-1 mAb (five animals per group). Systemic infusion of isolated E27 scFv was used as a positive control.
Figure 6 : The PD-1-blocking E27 scFv secreted by CAR-T cells is only detected in the local TME. (Cont,.) Fig. 6b) Schematic representation and quantitation of areas used for complete versus local detection of scFv or antibody. *P < 0.02 at all time points tested for antibody using multiple t test with three animals per group.
Figure 6 The PD-1-blocking E27 scFv secreted by CAR-T cells is only detected in the local TME. (a) Imaging and quantification over time of E27 scFv tagged with GLuc or fluorescently labeled anti-human PD-1 mAb in SKOV3-PDL1 tumor-bearing SCID/Beige mice treated i.p. with scFv-secreting CAR-T cells or CAR-T cells with anti-PD-1 mAb (three animals per group). (b) Schematic representation and quantitation of areas used for complete versus local detection of scFv or antibody. *P < 0.02 at all time points tested for antibody using multiple t test with three animals per group. (c) Quantification using unique peptide sequences by liquid chromatography-tandem mass spectrometry (LC-MS/MS) of serum levels over time of E27 scFv and anti-human PD-1 mAb in SKOV3-PDL1 tumor-bearing SCID/Beige mice treated i.p. with scFv-secreting CAR-T cells or CAR-T cells with anti-PD-1 mAb (five animals per group). Systemic infusion of isolated E27 scFv was used as a positive control.
Figure 6 : The PD-1-blocking E27 scFv secreted by CAR-T cells is only detected in the local TME. (Cont,.) To further quantify the systemic levels of antibody or scFv over time, we used targeted mass spectrometry on a high-resolution quadrupole orbitrap instrument Fig. 6c) Quantification using unique peptide sequences by liquid chromatography-tandem mass spectrometry (LC-MS/MS) of serum levels over time of E27 scFv and anti-human PD-1 mAb in SKOV3-PDL1 tumor-bearing SCID/Beige mice treated i.p. with scFv-secreting CAR-T cells or CAR-T cells with anti-PD-1 mAb (five animals per group). Systemic infusion of isolated E27 scFv was used as a positive control.