Download
1 / 18
180 likes | 259 Views
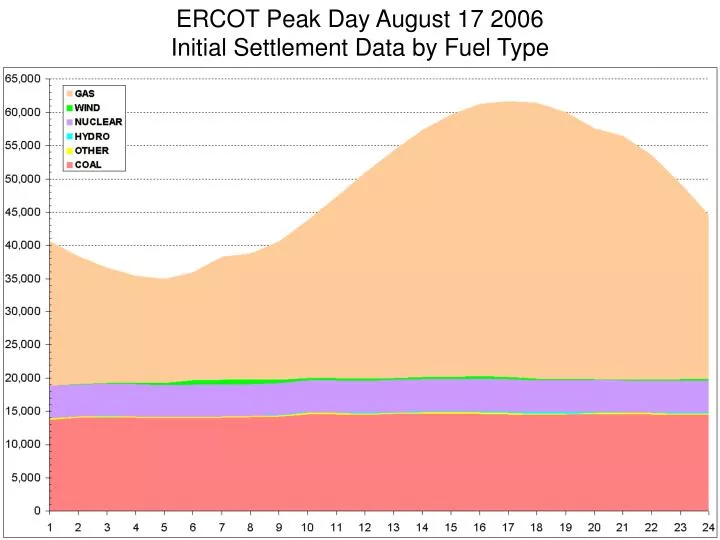
ERCOT Peak Day August 17 2006 Initial Settlement Data by Fuel Type. ERCOT AUGUST 17 PEAK DAY OPERATIONS DATA. 64,731 MW. 63,259 MW. 57,376 MW. ERCOT AUGUST 17 PEAK DAY OPERATIONS DATA Wind Generation. 2,300 MW Installed Capacity. 342 MW @ peak. ERCOT AUGUST 17 PEAK DAY OPERATIONS DATA

E N D
ERCOT Peak Day August 17 2006 Initial Settlement Data by Fuel Type
ERCOT AUGUST 17 PEAK DAY OPERATIONS DATA 64,731 MW 63,259 MW 57,376 MW
ERCOT AUGUST 17 PEAK DAY OPERATIONS DATA Wind Generation 2,300 MW Installed Capacity 342 MW @ peak
ERCOT AUGUST 17 PEAK DAY OPERATIONS DATA Hydro Generation 552 MW Installed Capacity 157 MW @ peak
ERCOT AUGUST 17 PEAK DAY OPERATIONS DATA DC Tie 855 MW Installed Capacity 459 MW @ peak
ERCOT AUGUST 17 PEAK DAY OPERATIONS DATA Dispatchable Generation 58,573 MW Installed Capacity 57,376 MW @ peak
ERCOT AUGUST 17 PEAK DAY OPERATIONS DATA Private Network Generation 6,397 MW @ peak Not Settlement Data 6,419 MW Reported Available
ERCOT AUGUST 17 PEAK DAY Operations and Planning Analysis
ERCOT AUGUST 17 PEAK DAY Operations and Planning Analysis
ERCOT AUGUST 17 PEAK DAY Peak Values
ERCOT AUGUST 17 PEAK DAY Peak Values
Weather Zone Forecasted Data Calendar Data Weather Data Economic Data Weather Zone Forecasted Data Weather Zone Historical Data Allocate Energy Weather Data ERCOT Summer Monthly Energy Model by weather zone ERCOT Total System Summer Hourly Load Shape Model by weather zone Economic Data Allocate Energy ERCOT Aggregated Weather Zone System Hourly Load Forecast ERCOT Winter Monthly Energy Model by weather zone Load Data ERCOT Total System Winter Hourly Load Shape Model by weather zone ERCOT Aggregated Weather Zone Peak and Energy Forecast Calendar Data ERCOT Spring/Fall Monthly Energy Model by weather zone Allocate Energy Weather Zone Historical Data ERCOT Total System Spring/Fall Hourly Load Shape Model by weather zone Six Regression Equations by weather zone Weather Zone Forecasting Process • 1. Obtain weather and economic variables by weather zone (historic and forecast) • 2. Develop regression equations by weather zone describing the historic actual: • --Monthly Energy • * Using a different equation for each season • -- Hourly Load Shape • * Using a different equation for each season • 3. Incorporate forecasted values of economic and normalized temperatures for 2006-2011 by weather zone into monthly energy equation to produce forecasted monthly energy • 4. Incorporate normalized temperatures for 2006-2011 by weather zone into monthly energy equation to produce forecasted load shape • 5. Produce hourly demand forecast by weather zone by fitting forecasted monthly energy under projected hourly load shape
Weather Zone Actual and Forecasted Data Calendar Data Actual Temp Data Economic Data Weather Zone Forecasted Data Weather Zone Historical Data Allocate Energy Weather Data ERCOT Summer Monthly Energy Model by weather zone ERCOT Total System Summer Hourly Load Shape Model by weather zone Economic Data Allocate Energy ERCOT Aggregated Weather Zone System Hourly Load Forecast ERCOT Winter Monthly Energy Model by weather zone Load Data ERCOT Total System Winter Hourly Load Shape Model by weather zone ERCOT Aggregated Weather Zone Peak and Energy Forecast Calendar Data ERCOT Spring/Fall Monthly Energy Model by weather zone Allocate Energy Weather Zone Historical Data ERCOT Total System Spring/Fall Hourly Load Shape Model by weather zone Six Regression Equations by weather zone Weather Zone Forecast Validation Process • Forecast Validation Summary: • 1. Use the same historical data up to December 31, 2005, as in the weather normalized forecast, to calculate the coefficients for validating the forecast. • 2. Produce the new forecast using actual 2006 temperatures and humidity (as contrasted with normalized weather profiles) but keep the same economic and other non-economic variables as used to produce the weather normalized long-term forecast by weather zone. • Forecast Validation Process: • 1. Produce regression equations by weather zone describing the historic actual: • --Monthly Energy • * Using a different equation for each season • -- Hourly Load Shape • * Using a different equation for each season • 2. Incorporate forecasted values for economic variables and actual values for temperatures and humidity for 2006 by weather zone into monthly energy equation to produce forecasted monthly energy • 3. Incorporate actual temperatures and humidity for 2006 by weather zone into load shape equation to produce forecasted load shape • 4. Produce hourly demand forecast by weather zone by fitting forecasted monthly energy under projected hourly load shape