Download
1 / 43
430 likes | 435 Views
Noncommunicable Diseases: An Overview. Dr Ala Alwan Assistant Director General World Health Organization. What do we mean by "noncommunicable diseases"? Magnitude and socioeconomic impact of NCDs The global vision and the plan Where are we now in implementing the vision

E N D
Noncommunicable Diseases: An Overview Dr Ala Alwan Assistant Director General World Health Organization
What do we mean by "noncommunicable diseases"? • Magnitude and socioeconomic impact of NCDs • The global vision and the plan • Where are we now in implementing the vision • Translating the Global Action into national action
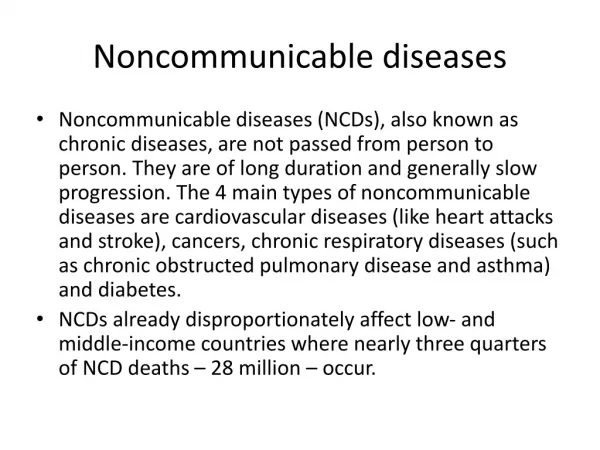
Scope Noncommunicable diseases (NCDs): • Cardiovascular diseases (e.g. heart diseases, stroke) • Cancers • Diabetes • Chronic respiratory diseases (e.g. asthma) Risk factors for noncommunicable diseases: • Tobacco use • Unhealthy diet • Physical inactivity • Harmful use of alcohol
Main data sources • 2008-2013 Action Plan of the Global Strategy for the Prevention and Control of NCDs • WHO Global Burden of Disease (2004 update published in October 2008) • WHO Global Health Risks (published in October 2009) • Further analysis on the burden of noncommunicable diseases based on the WHO Global Burden of Disease
Distribution of age at death and numbers of global deaths (2004)
The global burden of non-communicable diseases (based on the 2004 update of the Global Burden of Disease)
Please download at: http://www.who.int/healthinfo/global_burden_disease/2004_report_update/en/index.html
Source: 10% Total number of deaths in the world 60 million 5.8 M 26.0 M(above the age of 60) 50 million 40 million 35 million(60% of all deaths) 30 million 9.0 M (below the age of 60) 20 million 18.0 M 10 million 0 Group III - Injuries Low-income countries Group II – Other deaths from noncommunicable diseases Group II – Premature deaths from noncommunicable diseases (below the age of 60), which are preventable Group I – Communicable diseases, maternal, perinatal and nutritional conditions
Total number of deaths in the world Source: 25 million 2.3M 6.8 M 20 million 2.3M 3.7M 15 million 10.2M 13.6M 10 million 0.5M 5.9M 0.6M 3.3 M 3.3M 3.0M 3.0M 1.1M 0.9M Lower middle-income High-income countries Upper middle-income Low-income countries Group III - Injuries Low-income countries Group II – Other deaths from noncommunicable diseases Group II – Premature deaths from noncommunicable diseases (below the age of 60), which are preventable Group I – Communicable diseases, maternal, perinatal and nutritional conditions
Low- and middle-income countries which are most affected 70% of the global burden of premature deaths from NCDs(22 countries) • Afghanistan • Bangladesh • Brazil • China • DR Congo • Egypt • Ethiopia • India • Indonesia • Iran • Mexico • Myanmar • Nigeria • Pakistan • Philippines • Russian Federation • South Africa • Thailand • Turkey • Sudan • Ukraine • Vietnam
Group III - Injuries Low-income countries Group II – Other deaths from non-communicable diseases Group II – Premature deaths from non-communicable diseases (below the age of 70), which are preventable Group I – Communicable diseases, maternal, perinatal and nutritional conditions The magnitude in 144 low- and middle-income countries 60 million 10% 50 million 5.3 M 34% 28% 40 million 14.2 M 30 million 14.0 M 28% 20 million 17.4 M Omitted from the MDGs: 14.0 million premature deaths from non-communicable diseases Source: 10 million Total number of deaths in low- and middle-income countries (2004)
Source: Percentage of deaths in selected countries 100% 80% 60% 40% 20% 0% Benin Egypt Nepal Kenya Bolivia Ghana Bhutan Zambia Uganda Denmark Tanzania Viet Nam Nicaragua Bangladesh Mozambique Burkina Faso Group III - Injuries Low-income countries Group II – Other deaths from noncommunicable diseases Group II – Premature deaths from noncommunicable diseases (below the age of 60), which are preventable Group I – Communicable diseases, maternal, perinatal and nutritional conditions
Deaths in Africa* (2004) Group III - Injuries Low-income countries Group II – Other deaths from non-communicable diseases Group II – Premature deaths from non-communicable diseases (below the age of 60 (left) or 70 (right)) Group I – Communicable diseases, maternal, perinatal and nutritional conditions 14,000,000 7% 0.9 0.9 12,000,000 17% 1.4M 2.2M 10,000,000 2.2M(<70) 11%(<60) 1.4M (<60) 65% 8,000,000 8.1M 8.1M Lower margin 6,000,000 7% 11% 4,000,000 17%(<70) Source: 2,000,000 65% 0 Upper margin Lower margin Upper margin
More women aged 15-59 years die from NCDs in Africa than in high-income countries
Breakdown of deaths from non-communicable diseases 6% 6% 4% 3% 3% 3% 12% 13% 50% 49% 27% 25% All countries Low- and middle-income countries Cardiovascular diseases Cancers Respiratory diseases Diabetes Mental health conditions Other NCDs
Please download at: http://www.who.int/healthinfo/global_burden_disease/global_health_risks/en/index.html
Key findings • High blood pressure is the leading risk factor for mortality, responsible for 13% of deaths globally • Low fruit and vegetable intake, lack of exercise, alcohol and tobacco use, high BMI, high cholesterol, high glucose, and high BP are responsible for more than half of the deaths due to heart disease • Tobacco is responsible for 5.1 million deaths. Almost 1 in 8 deaths of adults over the age of 30 is due to smoking • Being overweight or obese is the fifth leading risk for death, responsible for 7 per cent of deaths globally • Unsafe sex, which leads to transmission of human papillomavirus, is responsible for deaths due to cervical cancer. Cervical cancer is the leading cause of cancer death in Africa.
% High blood pressure 12.8 Tobacco use 8.7 High blood glucose 5.8 Physical inactivity 5.5 Overweight and obesity 4.8 High cholesterol 4.5 Unsafe sex 4.0 Alcohol use 3.8 Childhood underweight 3.8 Indoor smoke from solid fuels 3.3 59 million total global deaths in 2004 % Childhood underweight 5.9 Unsafe sex 4.6 Alcohol use 4.5 Unsafe water, sanitation 4.2 High blood pressure 3.7 Tobacco use 3.7 Suboptimal breastfeeding 2.9 High blood glucose 2.7 Indoor smoke from solid fuels 2.7 Overweight and obesity 2.3 1.5 billion total global DALYs in 2004 Leading causes of attributable global mortality and burden of disease (2004) Attributable Mortality Attributable DALYs
Percentage of DALYs attributed to 19 leading risk factors (2004)
Tobacco Rising production and consumption in developing countries
Tobacco: The poor and uneducated are the ones who smoke the most Smoking prevalence in Bangladesh (1995) Source: Sen, B & Hulme D, 2004
Prevalence of obesity, ages 30+ (2004) male female South-East Asia Western Pacific Africa Eastern-Mediterranean Europe Americas 10% 30% 20% 0% 10% 20% 30% Source:
SEA 3% 6% West Pac 9% 9% Africa 5% 13% 12% 30% Eastern-Med Europe 21% 29% Prevalence of obesity, ages 30+ (2015) Americas 32% 46% male female
The top-10 countries reported to have the highest diabetes prevalence are countries in developing regions of the world. ( ) ( ) Source: International Diabetes Federation's Diabetes Atlas
Global projections (2004 to 2030) Cancers 12 10 Ischaemic HD Stroke 8 Deaths (millions) 6 Acute respiratoryinfections 4 Road trafficaccidents Perinatal 2 HIV/AIDS TB Malaria 0 2000 2005 2010 2015 2020 2025 2030
Projections for the future Death from noncommunicable diseases Increases (in percentage and millions) in 2015 vs 2004 30% 2.5M 25% 2.0M 20% 1.5M 15% 1.0M Source: 10% 0.5M 5% 0% 0 Africa Americas Eastern Med Europe South- East Asia Western Pacific Africa Americas Eastern Med Europe South- East Asia Western Pacific
Mortality: Global projections (2004 to 2030) 30 Intentional injuries Other unintentional 25 Road traffic accidents Other NCD 20 Cancers Deaths (millions) 15 CVD 10 Mat//peri/nutritional 5 Other infectious HIV, TB, malaria 0 2004 2015 2030 2004 2015 2030 2004 2015 2030 High-income countries Middle-income countries Low-income countries
What will happen if nothing is done now? Projections of estimated deaths from noncommunicable diseases (millions) Source:
Why low- and middle-income countries are disproportionally affected
NCDs and Development Poverty contributes to NCDs and NCDs cause poverty Poverty at household level Populations in low- and middle-income countries Population ageing and Increased exposure to common risk factors Loss of household income Noncommunicable diseases Limited access to effective and equitable health-care services More than 8 million people die before the age of 60 in developing countries from noncommunicable diseases
The poorest people in developing countries are often affected the most The poorest people smoke the most, often spending more than 10 per cent of their household income on tobacco Smoking prevalence 45 Lowest household income quintiles 40 35 30 Highest household income quintiles 25 % 20 15 10 5 0 Upper-middle-income High-income Low-income countries Lower-middle Income
The poorest people in developing countries affected the most The cost of caring for a family member with diabetes can be more than 20 per cent of low-income household incomes in developing countries The cost per year of diabetes care at household level
Percent and number of men with and without CVD experiencing catastrophic spending and impoverishment- 2005 Number 1.4 – 2.0 million 0.6-0.8 million affected Source: Mahal et al 2010 Catastrophic spending >30% HH income in one year; Impoverishment from above poverty line to below during year
Source: Mahal et al 2010 Catastrophic spending >30% HH income in one year; Impoverishment from above poverty line to below during year
NCDs and DevelopmentConclusions The premature death, the morbidity and disabilities caused by NCDs lead to lost productivity Families with members who have NCDs are at increased financial risk and are more likely to be exposed to catastrophic spending and impoverishment NCDs impede poverty reduction efforts
The macro-economic impact of NCDs Oil and gas price spike Retrenchment from globalization Asset price collapse NCDs Fiscal crisis Flu pandemic World Economic Forum: Global Risk Assessment 2009 Food crisis http://www.weforum.org/pdf/globalrisk/globalrisks09/global_risks_2009.pdf Infectious disease
Key messages • NCDs are already leading health problems in almost all countries and their magnitude is still increasing • Shared risk factors • Premature deaths • The poor are disproportionately affected • Negative impact on socioeconomic development • As countries continue to develop, market forces will further promote unhealthy patterns. • Action is urgently needed