Download
1 / 13
130 likes | 262 Views
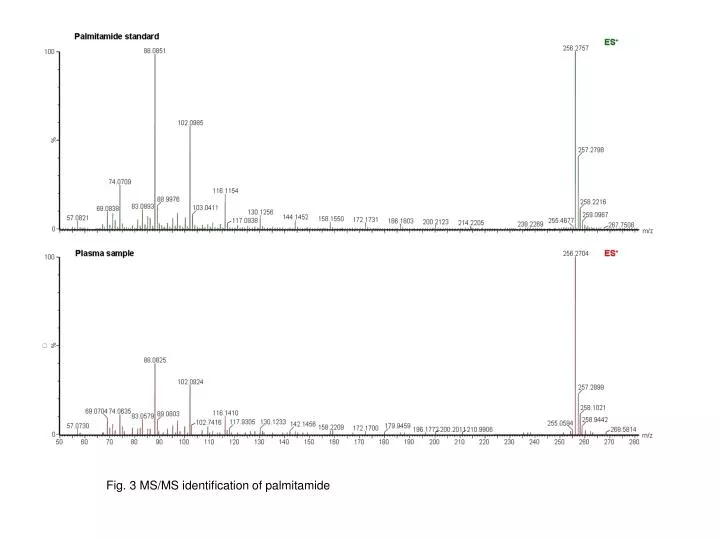
Fig. 3 MS/MS identification of palmitamide. Fig. 4 MS/MS identification of LPC 18:1. Both protonated and sodiated ions were detected in plasma sample. Fig. 5 MS/MS identification of GCDCA. Oleamide standard. 97.0982. 83.0919. 100. 69.0805. %. 111.1032. 135.1219. 121.1098. 67.0679.

E N D
Fig. 4 MS/MS identification of LPC 18:1. Both protonated and sodiated ions were detected in plasma sample.
Oleamide standard 97.0982 83.0919 100 69.0805 % 111.1032 135.1219 121.1098 67.0679 149.1362 247.2457 177.1670 163.1521 282.2817 240.2720 265.2626 191.1814 0 Plasma sample 97.0910 100 83.0928 69.0749 % 109.1698 111.0652 282.2414 265.2572 67.0564 135.1138 114.0703 149.1301 240.2615 177.1645 154.0719 191.1799 57.0731 0 m/z 60 80 100 120 140 160 180 200 220 240 260 280 ES+ m/z ES+ Fig. S-1 MS/MS identification of Oleamide
Sodium taurochenodeoxycholate standard (C26H44NNaO6S ) ES+ 148.0102 486.2664 100 % 487.2825 148.9356 361.2490 522.2885 150.8724 379.3045 468.3046 257.2013 562.9979 322.2953 230.0896 98.4642 m/z 0 Plasmasample ES+ 464.2926 100 339.2896 126.0596 % 321.2859 465.3123 229.2090 215.2148 340.3121 148.0559 243.2211 466.3018 382.2380 121.1372 257.2239 467.2372 554.6915 400.4286 508.3459 0 m/z 50 100 150 200 250 300 350 400 450 500 550 600 Fig. S-2 MS/MS identification of TCDCA
ES+ 100 % 0 100 % 0 m/z 50 60 70 80 90 100 110 120 130 140 150 160 170 180 190 200 210 220 230 240 myristamide 88.0837 228.2312 102.1001 229.2378 74.0703 116.1161 89.0029 69.0842 230.2383 130.1229 210.2241 144.1373 158.1525 172.1697 186.1868 233.9384 200.1963 m/z Plasma sample ES+ 228.2354 88.0830 102.0994 229.2067 74.0693 116.1067 88.9649 230.0851 57.0619 130.1229 172.1677 225.1407 186.1515 144.1418 158.1574 191.1803 Fig. S-3 MS/MS identification of myristamide
Stearamide standard ES+ 284.2934 100 88.0828 % 285.3041 102.0969 74.0714 116.1103 286.2861 130.1280 158.1555 242.2732 200.2066 228.2274 0 Plasma sample ES+ 100 % 0 m/z 60 80 100 120 140 160 180 200 220 240 260 280 m/z 284.2927 88.0861 285.3134 102.1337 74.1007 116.1105 286.1303 282.3272 200.2159 241.0998 211.0784 158.1562 Fig. S-4 MS/MS identification of stearamide
LPC 16:0 standard ES+ 184.0711 104.1067 100 % 184.4662 478.3609 496.3661 86.1029 105.1241 497.3843 185.0922 313.3015 258.1380 419.2963 186.0959 0 Plasma sample ES+ 184.0789 100 104.1128 496.3280 % 497.3416 478.3276 86.1055 185.0637 105.0450 498.3250 313.2797 258.1137 419.2554 186.9308 332.2552 0 m/z 50 100 150 200 250 300 350 400 450 500 m/z Fig. S-5 MS/MS identification of LPC 16:0
Plasma sample (LPC 18:2) ES+ 184.0269 100 103.7673 % 483.2430 542.3228 484.2688 185.0532 104.6734 85.6168 359.2711 258.1241 337.2780 186.7824 439.2175 0 m/z 50 100 150 200 250 300 350 400 450 500 Fig. S-6 Identification of LPC 18:2 based on characteristic peak of LPC m/z 104 , m/z 184 and parent ion m/z 542.3228.
ES+ Glycocholic acid hydrate standard C26H43NO6 412.2867 100 337.2607 % 430.2945 319.2397 431.3157 338.2763 227.1719 209.1627 135.1138 241.1799 158.0823 466.3542 339.2040 76.1665 0 ES+ 412.3047 100 % 337.2750 430.3129 319.2731 338.2969 227.1730 209.1612 158.1251 466.3375 339.2534 228.3072 295.2467 76.0700 0 m/z 50 75 100 125 150 175 200 225 250 275 300 325 350 375 400 425 450 m/z Plasma sample Fig. S-7 MS/MS identification of GCA
LPC 18:0 standard ES+ 104.1067 184.0711 100 % 184.4712 524.3940 506.3883 525.4153 104.4039 185.0922 341.3346 258.1380 447.3288 0 Plasma sample ES+ 184.0249 100 524.3646 103.7603 % 525.3730 506.3623 185.0236 104.7070 447.2833 526.3519 341.3194 258.1206 448.2986 0 Plasma sample ES+ 487.2747 546.3552 100 103.7638 % 547.3658 488.2690 104.7008 548.3325 146.8406 202.9821 253.3541 367.9944 489.2509 341.3151 443.2455 0 m/z 50 100 150 200 250 300 350 400 450 500 550 600 [M+H]+ m/z [M+H]+ m/z [M+Na]+ Fig. S-8 MS/MS identification of LPC 18:0
Taurocholic acid sodium salt hydrate standard ES+ 148.0083 100 502.2596 484.2509 413.2638 % 395.2544 538.2867 414.2677 149.9551 359.2393 337.2541 295.2061 130.9771 229.1861 74.5704 0 Plasma sample ES+ 462.2679 100 % 463.2744 337.2772 126.0481 199.1515 480.2889 227.1530 338.2509 393.4777 93.0650 295.2412 498.2852 147.1109 227.8371 76.0389 0 m/z 50 100 150 200 250 300 350 400 450 500 550 520.2637 m/z 516.2452 Fig. S-9 MS/MS identification of TCA
Plasma sample (LPC 20:4 ) ES+ 184.0252 100 544.3327 103.7619 % 545.3466 526.3320 185.0208 104.7158 546.3611 258.1243 484.2587 361.2805 467.2707 311.9883 0 Plasma sample (LPC 20:4) ES+ 507.2515 100 566.3214 103.7680 % 567.3260 508.2533 184.0588 569.3107 383.2686 508.9948 80.5386 185.9560 231.7320 463.2348 0 m/z 50 100 150 200 250 300 350 400 450 500 550 600 [M+H]+ m/z [M+Na]+ Fig. S-10 Identification of LPC 20:4 based on characteristic peaks of LPCs: m/z 104 , m/z 184 and the parent ion m/z 544.3327.