Download
1 / 14
140 likes | 264 Views
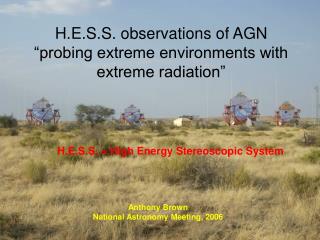
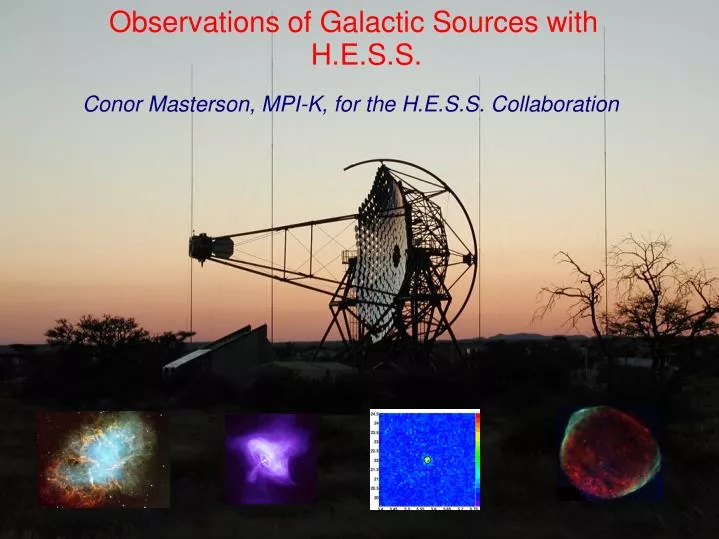
Observations of Galactic Sources with H.E.S.S. Conor Masterson, MPI-K, for the H.E.S.S. Collaboration. The H.E.S.S. Experiment. Overview See O.G. 2.5-7 (W. Hofmann) Array Situated in Namibia, southern Africa 23 o 16’ S, 16 o 30’ E, 1800 m asl 4 telescopes, 120 metre separation

E N D
Observations of Galactic Sources with H.E.S.S. Conor Masterson, MPI-K, for the H.E.S.S. Collaboration
The H.E.S.S. Experiment • Overview • See O.G. 2.5-7 (W. Hofmann) • Array • Situated in Namibia, southern Africa • 23o16’ S, 16o30’ E, 1800 m asl • 4 telescopes, 120 metre separation • Telescope Structures • 12 metre diameter reflector dish (Davies - Cotton) • 15 metre focal length • Mirrors • 380 front aluminised glass mirrors • Camera • See O.G. 2.5-10 (P. Vincent) • 960 photomultiplier tubes • 0.16 deg. pixel size • 5 deg. field of view • Integration time 16ns
Galactic Sources • Crab Nebula • Observed October - December 2002 • Single telescope (CT3) • Conservative run quality selection • 4.86 hours of data (on source, livetime corrected) • SN 1006 • Observation position: • Centre of SNR (15h2m21.6s, -41˚d54'0'') • Cangaroo hotspot offset by 0.3 degrees • Observed March – May 2003 • 2 Telescopes, triggered independently (CT2 and CT3) • Good quality On/Off pairs selected • 7 hours total (on source, livetime corrected) • Other Sources • Observations made, analysis ongoing
Analysis of Data • Calibration • See O.G. 2.5-11 (N. Leroy) • Parameterisation • Two level “Tailcut” image cleaning • Standard Hillas moment analysis • Background rejection • Simple cuts optimised on simulated γ – rays • Separate cuts for large and small zenith angles • Source position reconstruction • Single telescope 2-D reconstruction technique Reconstructed theta2 distribution for simulated γ - rays
Crab Nebula • Crab result: • 4.86 hours livetime • Alpha analysis • 17.7 σ (8.1 σ hr -0.5) • 3.09 γ min-1 • 2-D analysis: • 22.4 σ (10.2 σ hr -0.5) • 2.94 γ min-1 • Flux (>1 TeV): • 2.58 ± 0.2 x 10 -7 m-2 s -1 • Paper: 2.64 ± 0.2 x 10 -7 m-2 s -1 On/Off Theta2 distribution On/Off Alpha
Crab Stability • Stable excess • three months of obs. • Mean zenith angle: • 46 deg. • Energy Threshold: • 780 GeV Cumulative significance Significance distribution per bin in 2-d plot Run by run light curve
Offset Position Observations • Offset of 0.3 deg RA • 19 min. on source livetime • 2-D analysis • 5.8 σ (10.2 σ hr -0.5) • 2.63 γ min-1 • Consistent with on source obs. • Wobble mode • 4.9 σ (8.7 σ hr -0.5) • 2.32 γ min-1 Ra/Dec skymap of significance, black circle - Crab position red circle - wobble Off region Theta2 distribution black points – Crab position Filled region – Off run data blue line – Wobble position
SN1006 CT2 • Observations • 2.54 hrs livetime • 9 On/Off pairs • after quality selection • 2-D Excess: • -1.3 σ • Background after cuts • 0.96 min.-1 Cangaroo hotspot marked by circle Excess as function of distance from Cangaroo hotspot
SN 1006 CT3 • CT3 Observations: • 4.5 hrs livetime • 14 On/Off pairs • after quality selection • 2-D excess: • 1.0 σ • Background after cuts • 0.96 min.-1 Cangaroo hotspot marked by circle Excess as function of distance from Cangaroo hotspot
SN 1006 stability CT2 CT3 Run by run Light curve Distribution of significance in 2-d plot
Data checks for SN1006 Dec (deg.) • Pointing • Star positions measured with pixel currents • Stars match to 10th mag. • Good correlation in all SN 1006 runs • Trigger Rate • Runs selected for trigger rate stability • Camera Efficiency • Measured from muons, stable over epoch Run by Run Trigger rate, On and Off RA (hrs) RA/Dec plot of pixel currents for SN1006 (run 9951)
Conclusion • Crab Nebula • Observed with high significance • Signal stable over epoch • Flux (> 1 TeV): • 2.58 ± 0.2 x 10 -7 m -2 s -1 • consistent with other measurements • Energy threshold (post selection cuts) • 780 GeV • average zenith angle 46 deg. • Wobble mode, 2-d analysis consistent • SN1006 • 7 hours of observations (livetime on source) • No significant signal seen at Cangaroo hotspot • No other significant emission in field of view • Other Galactic Sources • Analysis is ongoing • Extragalactic sources – see O.G. 2.3-5 (A. Djannati-Atai)
Selection Cuts • Image Cleaning thresholds • 5,10 (pe) Large Zenith Angle (Crab) Shape cuts: 0 < Length < 4.8 (mrad) 0.05 < Width < 1.3 (mrad) 0 < Len/Size < 0.016 (mrad/pe) Alpha Analysis 0 < Dist < 17.0 (mrad) Alpha < 9 degrees 2-d Analysis 0 < Theta2 < 0.04 (deg.2) Small Zenith Angle (SN 1006) Shape cuts: 0 < Length < 6.8 (mrad) 0 < Width < 1.5 (mrad) 0 < Len/Size < 0.016 (mrad/pe) Alpha Analysis 0 < Dist < 19.0 (mrad) Alpha < 6 degrees 2-d Analysis 0 < Theta2 < 0.04 (deg.2)
Other Systematic checks • Exact Run selection criteria • Trigger rate variations • Rate,rms variation • Radiometer data • Calibration • Gain stability • Pedestals, drifts • Flatfielding • Muon efficiencies • Evolution plot • Length/size peak pos. • MC/data parameter comparison • Hillas parameters • Selection efficiencies • Offset MC selection efficiency • Problematic pixel selection • Broken Pixel plots Run – Run Muon efficiency