Download
1 / 9
90 likes | 203 Views
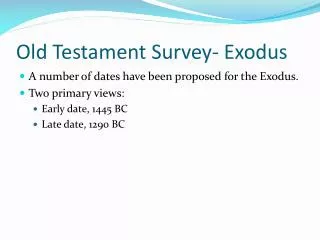
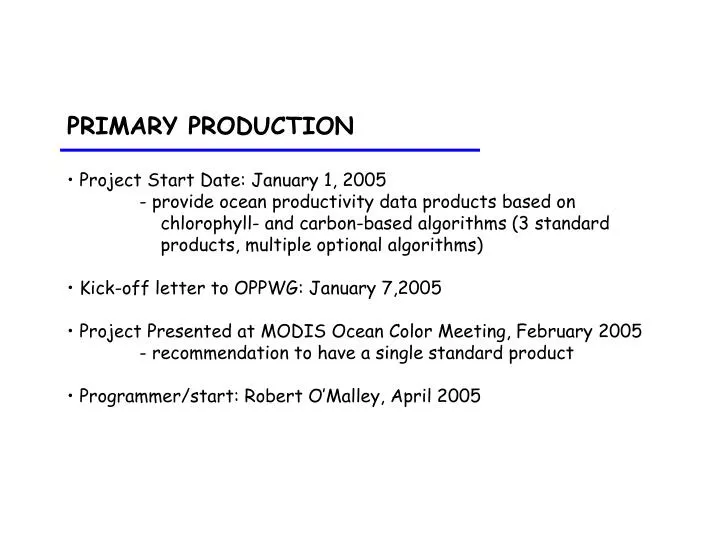
PRIMARY PRODUCTION Project Start Date: January 1, 2005 - provide ocean productivity data products based on chlorophyll- and carbon-based algorithms (3 standard products, multiple optional algorithms) Kick-off letter to OPPWG: January 7,2005

E N D
PRIMARY PRODUCTION • Project Start Date: January 1, 2005 • - provide ocean productivity data products based on • chlorophyll- and carbon-based algorithms (3 standard • products, multiple optional algorithms) • Kick-off letter to OPPWG: January 7,2005 • Project Presented at MODIS Ocean Color Meeting, February 2005 • - recommendation to have a single standard product • Programmer/start: Robert O’Malley, April 2005
Download standard products #1 • The Ocean • Productivity • Home Page • Overview • Navigation Description of standard products Thumbnails comparing standard product with alternative algorithms • Standard Products • DIM w/ polynomial rate • DIM w/ exponential rate • Carbon-based production
Download standard products Link MODIS land • Biospheric NPP • Products • MODIS • CASA #1 Link CASA site • The Ocean • Productivity • Home Page • Overview • Navigation Description of standard products Thumbnails comparing standard product with alternative algorithms #2 Supporting Field Data -14C -Fluorescence • Custom • Products • Alternative models • Statistical compare • Short description Link Rutgers site #3 DIMs History Discussion of the Productivity Problem TIMs Model Evolution Full description Order Alternative products WIMs Links to related sites Basics #4 WRMs Photosynthesis Model Code Physiology Round Robin Results Outstanding problems Highlights #7 Space/Time convergence #6 Visualization Products Educational Products #5 Images Decision/Policy Information Trends Course Work Pub’s Statistics Implications Intro to Ocean Color Interactive Products
700 = 400 NPP = (,t,z) PAR (,t,z) a*(,z) Chl (z) d dt dz NPP = (t,z) PAR (t,z) Chl (z) dt dz NPP = Pb (z) PAR (z) Chl (z) dz NPP = Pbopt PAR0 Chl0 Zeu d.l. Zeu z = 0 Zeu z = 0 Zeu z = 0 sunset t = sunrise sunset t = sunrise Ocean Model Classifications I. Wavelength-resolved models II. Wavelength-integrated models III. Time-integrated models IV. Depth-integrated models
Form of Rate Term Polynomial Exponential GCM’s
f (Iz) Io / Ik Net Primary Production = Gross Carbon Fixation – Phytoplankton Respiration Net Primary Production = mg C m-3 d-1 = number of cells average carbon fixed per cell = biomass biomass specific rate NPP = Chlorophyll Pb NPP = Carbon Areal NPP (m-2) = biomass biomass specific rate f (Iz) f (biomassz) f (Kd)
Light limitation dominates Light-Nutrient interactions Light versus Nutrient as dominant control Pbopt (max) Temperature
1500 1200 800 Net Primary Production (mg m-2) 400 0 800 400 0 Difference (mg m-2) -400 -800 NPP = f [Carbon, Zeu, , g (I0)] Boreal Summer Boreal Winter Carbon-based Chlorophyll-based Difference