Download
1 / 20
210 likes | 341 Views
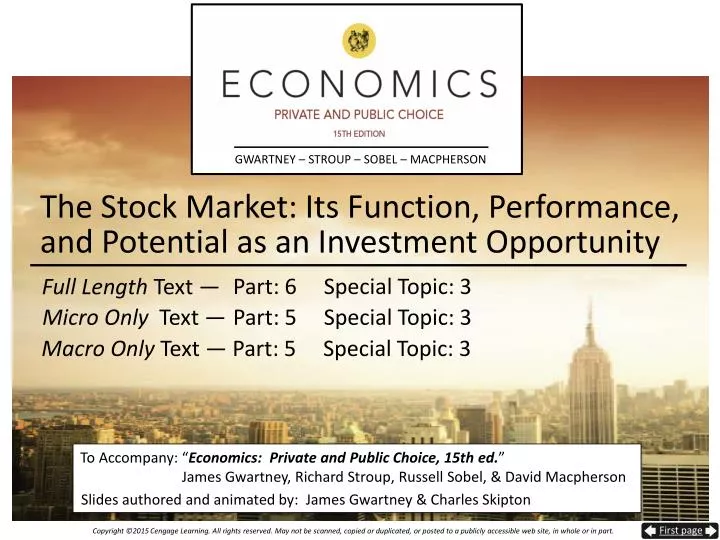
The Stock Market: Its Function, Performance, and Potential as an Investment Opportunity. The Economic Functions of the Stock Market . The Economic Functions of the Stock Market.

E N D
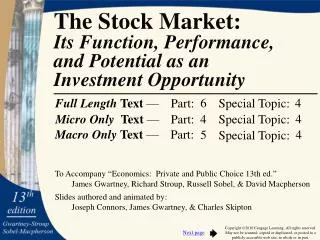
The Stock Market: Its Function, Performance, and Potential as an Investment Opportunity
The Economic Functions of the Stock Market • The stock market provides investors, including those who are not interested in participating directly in the operation of the firm, with an opportunity to own a fractional share of the firm’s future profits. • New stock issues are often an excellent way for firms to obtain funds for growth and product development. • Stock prices provide information about the quality of business decisions.
Avg compound return The Economics of the Stock Market • The stock market allows investors to participate in the risks and opportunities of corporate America. • Real returns for the past 2 centuries have averaged 7% per year. • During the last 62 years, the S&P 500 indicates investors earned a 10.5% compound annual rate of return. • Double-digit returns were earned during 38 of 62 years, while returns were negative during only 14. S&P 500 Return 50% 40% 30% 20% 10% 0% - 10% - 20% - 30% - 40% 2012 1980 2000 1990 1950 1970 1960
The Interest Rate, the Value of Future Income, and Stock Prices
Stock Prices • Underlying the price of a firm’s stock is the present value of the firm’s expected future net earnings, or profit. • The value of a share depends on: • the expected size of future net earnings, • when these earnings will be achieved, and, • the interest rate by which the investor discounts the future income.
D3 D2 D n D1 . . . . . + + + + (1 + i) (1 + i)2 (1 + i)3 (1 + i) n Stock Prices • The present value of a future income stream is dependent upon: • D – dividends (and gains from higher stock prices) earned during various future years (as indicated by the subscripts). • i – the discount or interest rate • It is calculated as:
The Price to Earnings Ratio, 1950-2012 • The average price-earnings ratio for the S&P 500 index since 1950 is 18. • It was between 8 and 24 during the 1951 to 1997 period. • During the 1970s it stayed in the 8 to 10 range. It increased from 1985 - 1997 and soared above 30 in the 1998 to 2002 period. • A sharp decline in earnings during the 2008-2009 recession lead to its peaking near 80 in 2009. 90 Price-to-Earnings Ratio 80 70 60 50 40 30 20 10 0 1970 1980 1950 1960 2000 1990 2012
Random Walk Theory • When considering the future of stock prices, many economists stress the implications of the random walk theory. • According to this theory: • current stock prices already reflect known information • future changes in stock prices are determined by surprise occurrences • therefore, no one can forecast future stock prices with any degree of precision
How the Ordinary Investor Can Beat the Experts • Savers invest in the stock market as a strategy to build wealth. • Investors that buy a diverse portfolio of shares and hold them over long periods of time, substantially reduce their risks. • Small investors can purchase stock in an equity mutual fund, a corporation that buys & holds shares of stock in many firms. • Equity mutual funds have reduced the risk of stock ownership and attracted large amounts of funds into the market.
The Value of Equity Mutual Funds,1980-2012 • The amount of money that people put into U.S. equity mutual funds rose dramatically in the 1990s. • Purchasing shares in a mutual fund is a simple way for an individual to buy and hold an interest in a large variety of stocks with one purchase. • Due to the recent financial crisis, the value of equity mutual funds fell by 43% from 2007 to 2008, before rebounding sharply in 2009-12. Value of Stocks Owned Through Equity Mutual Funds (Billions $) 7,000 6,500 6,000 5,500 5,000 4,500 4,000 3,500 3,000 2,500 2,000 1,500 1,000 500 0 1990 1995 1980 1985 2005 2000 2012
47.2% 29.8% 13.8% 9.5% 2.7% - 1.1% - 16.7% - 40.8% Stocks are Less Risky When Held for a Lengthy Time Period Highest and Lowest Period Annualized Total Real Return (%) S&P 500 Index • This graphic highlights the best and worst annualized performance for each holding period from 1871 – 2012. • There is less risk of a low or negative return when a portfolio of S&P 500 stocks is held for a longer period of time. 1-year periods 5-year periods 20-year periods 35-year periods
The Advantages of Indexed Mutual Funds • A managed equity mutual fund is one with a portfolio manager who tries to pick stocks that maximize the fund’s rate of return. • An indexed equity mutual fund holds a portfolio of stocks that matches their share in a broad index like the S&P 500. • Indexed mutual funds have substantially lower operating costs than managed funds as they engage in less trading and have no need for either a market expert or research staff. • Historically, indexed funds have outperformed managed funds.
Should You Invest in a FundBecause of its Past Performance? • Should you invest in a fund because of its past performance? • No. • Past performance is not a reliable indicator of future performance. • Why? • Some of the mutual funds with above-average returns during a period were merely lucky. • A strategy that works well in one environment (inflationary conditions, for example) is often disastrous when conditions change.
Questions for Thought: 1. A friend who just inherited $50,000 asks for your advice about how to invest it in the stock market for her retirement (in 30 yrs). Is the stock market a good place for her funds? What do you think is the best plan for her to attain a high rate of return at a relatively low risk? Explain. 2. What is the random walk theory of stock prices? What does it imply about the ability of the “experts” to select stocks that will increase in price and avoid those that will decline in price.
Questions for Thought: 3. “Stock prices are way too high. The stock market must fall.” -- Analyze this view. 4. Many personal finance magazines such as Money and Smart Money routinely give advice as to which stocks to buy. -- Should you take their advice?
End of Special Topic 3