Download
1 / 30
300 likes | 308 Views
This presentation explores the relationship between the proximity of fast food restaurants to schools and adolescent obesity rates in low-income neighborhoods in California. It also discusses the impact of the Supplemental Nutrition Assistance Program on improving access to nutritious foods for low-income households.

E N D
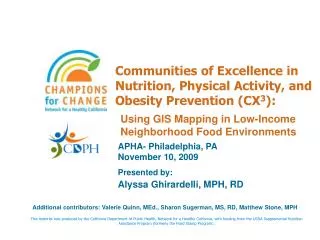
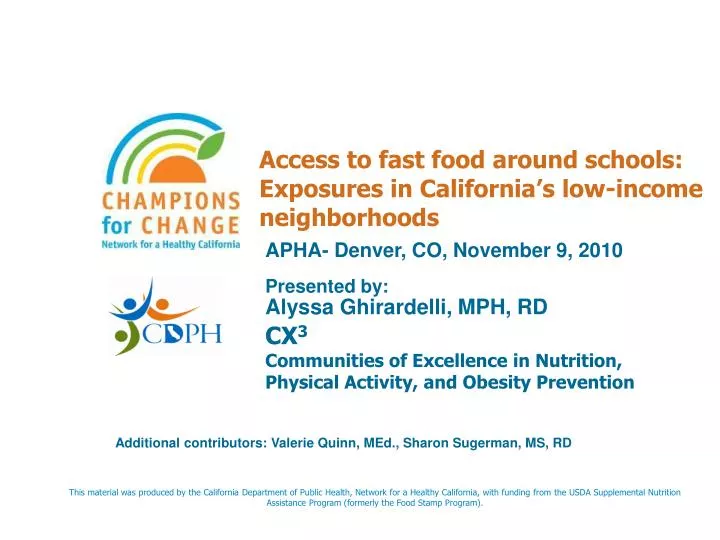
Access to fast food around schools: Exposures in California’s low-income neighborhoods CX3Communities of Excellence in Nutrition, Physical Activity, and Obesity Prevention APHA- Denver, CO, November 9, 2010 Presented by: Alyssa Ghirardelli, MPH, RD Additional contributors: Valerie Quinn, MEd., Sharon Sugerman, MS, RD This material was produced by the California Department of Public Health, Network for a Healthy California, with funding from the USDA Supplemental Nutrition Assistance Program (formerly the Food Stamp Program). This material was produced by the California Department of Public Health, Network for a Healthy California, with funding from the USDA Supplemental Nutrition Assistance Program (formerly the Food Stamp Program). These institutions are equal opportunity providers and employers. In California, food stamps provide assistance to low-income households, and can help buy nutritious foods for better health. For food stamp information, call 877-847-3663. For important nutrition information visit www.cachampionsforchange.net. This material was produced by the California Department of Public Health, Network for a Healthy California, with funding from the USDA Supplemental Nutrition Assistance Program (formerly the Food Stamp Program). These institutions are equal opportunity providers and employers. In California, food stamps provide assistance to low-income households, and can help buy nutritious foods for better health. For food stamp information, call 877-847-3663. For important nutrition information visit www.cachampionsforchange.net. This material was produced by the California Department of Public Health, Network for a Healthy California, with funding from the USDA Supplemental Nutrition Assistance Program (formerly the Food Stamp Program). These institutions are equal opportunity providers and employers. In California, food stamps provide assistance to low-income households, and can help buy nutritious foods for better health. For food stamp information, call 877-847-3663. For important nutrition information visit www.cachampionsforchange.net.
Presenter Disclosures Alyssa Ghirardelli, MPH, RD (1) The following personal financial relationships with commercial interests relevant to this presentation existed during the past 12 months: No relationships to disclose
Fast Food in Close Proximity to Schools : Evidence • Davis, et al. Proximity of Fast Food Restaurants to schools and Adolescent Obesity.Am J Public Health, 2009. • Links fast-food within a ½ mile of schools to higher BMI and poor dietary behaviors • Simon, et al. Proximity of fast food restaurants to schools: Do neighborhood income and type of school matter? Preventive Med, 2008. • Austin, et al. Clustering of fast-food restaurants around schools a novel application of spatial statistics to the study of food environments. Am J Public Health, 2005. • Kwate, et al. Separate and unequal: the influence of neighborhood and school characteristics on spatial proximity between fast food and schools. Prev Med. 2010
California Teen Eating, Exercise, and Nutrition Survey (CalTEENS) Trends Overweight and Obesity California Teens Aged 12-17 28.6 26.7 24.3 23.4 21.8 21.3 (BMI ≥ 85th %ile 1998-2004 p<.001), (BMI ≥ 85th %ile 2002-2004 p<.01) (BMI ≥ 95th %ile 1998-2004 p<.001), (BMI ≥ 85th %ile 2004-2008 p<.001)
CalTEENS Comparison to National and other Statewide DataObese (BMI ≥ 95th percentile) Sex-and age-specific BMI ≥ 95th percentile based on the CDC growth charts Sources: -University of California Los Angeles Center for Health Policy Research. California Health Interview Survey, Adolescent Survey AskCHIS internet data query system In. Los Angeles, CA. http://www.chis.ucla.edu/main/, Accessed 9/28/10. -Youth Risk Behavior Surveillance - United States, 2009. http://apps.nccd.cdc.gov/youthonline/App/Default.aspx, Accessed on 9/28/10. -Prevalence of Obesity Among Children and Adolescents: United States, Trends 1963-1965 Through 2007-2008 by Cynthia Ogden, Ph.D., and Margaret Carroll, M.S.P.H., Division of Health and Nutrition Examination Surveys
Fast Food and Soda Consumption Among Youth Ages 12-17 • 23% reported eating fast food at least once on a previous day (CalTEENS 2006) • 46% of youth report eating fast food 2 or more times per week (CHIS 2007) • 13% report 4 or more times each week (CHIS 2007) • Nearly 9% reported eating fast food 2 or more times on a previous day (CHIS 2005) • 26% drank 2 or more SSB’s per day, down from 31% on previous survey (CHIS 2005, 2007) • 60-62% drank one or more SSB per day (CalTEENS 2006, CHIS 2005)
“ Back in the days when we first got a company airplane, we used to spot good locations for McDonald’s stores by flying over a community and looking for schools. Now we use a helicopter, and it’s ideal.” Ray Kroc, McDonald’s Corporation founder Reference: Ray Kroc, Grinding It Out: The Making of McDonald’s, (Chicago, IL: Contemporary Books,1977), 176. – Found in: Corporate Accountability International’s, Clowning with Kids Health, The Case for Ronald McDonald’s Retirement. www.retireronald.org. Accessed 9/30/10.
England Allows Ban FF Around Schools 400 Meter Exclusion Zone (aprox. = 1300 feet, ¼ mile, or 2 blocks) Study found that secondary schools have on average 23 junk food outlets in their neighborhoods, with some surrounded by 46
CX3: Communities of Excellencein Nutrition, Physical Activity and Obesity Prevention • Documents the physical environment and encourages local action to change conditions to support individual behaviors • Involves assessing communities in relation to a variety of obesity prevention benchmarks known as community indicators and assets • Uses data to activate consumers and partners to improve food availability in low-income neighborhoods • 3= nutrition, physical activity and obesity prevention
CX3 Data: Mapping • Access to Supermarkets • Markets with >20 employees • ½ mile service area • Transit to supermarkets • Density of Fast Food • Fast food chain/not chain • Pizza • Deli • Small Markets & C-Stores around schools • Farmers Markets
CX3:Use of On-line Network GIS Map Viewerhttp://www.cnngis.org
CX3 Data: Field Surveys • Grocery stores and small markets • Different types of stores • Availability and quality of fruits and vegetables, other healthy foods • Fruit and vegetable prices • Marketing of healthy/unhealthy foods • Fast food around schools • Availability of healthy options • Menu labeling • Marketing • Outdoor marketing around schools
CX3 Data:Assessment/Tracking • Alternative Food Sources • Community Supported Agriculture • Produce Stands • Community Gardens • Emergency Food Sources • Local Health Department Infrastructure • Media Coverage
CX3 Sites 23 Network funded Local Health Departments All types: Urban dense, suburban, rural, remote More w/ other funding, including CA Regional Obesity Prevention Projects
CX3 Neighborhood Selection • 3-7 low-income neighborhoods • Each neighborhood comprised of • 1-5 census tracts • > 50% of population in census tract at or below 185% Federal Poverty Level (FPL) • Other selection factors • School in Neighborhood • Established partnerships • Race/Ethnic make-up • Rural and Urban (for some sites) • Obesity rates (used by one site)
CX3 Fast Food Outlets • Fast Food Chain, Non-Chain, Pizza, Sandwich/Deli • Quick service restaurants characterized by: • food ready to eat quickly after ordering • minimal service • where the customer pays for food prior to its consumption • Number of outlets within 1000 ft and ½ mile to schools in neighborhood • Proportion of schools with fast food outlets within 1000 ft and ½ mile • Highest number of outlets for a school with fast food within 1000 ft and ½ mile (ie. worst case scenario)
Fast food around schools & parks ½ mile buffer
CX3 GIS Findings- Fast Food Around Schools- From GIS Mapping • 1000 ft (approx. 2 blocks) • 49% had no fast food • 30% had 1-2 fast food • ½ Mile • only 11% had none • 22% 10+ • Mean of 6 fast food
CX3 Fast Food Surveys - Dataset • 14 Local Health Departments (LHD) • Surveys of Fast Food from 2008 & 2009 • Collected by either LHD staff, community members or youth with quality control methods • 31 Neighborhoods • Most neighborhoods defined by 1-2 census tracts • 44 Schools Reporting Fast Food in ½ mile • Sample of 34% Elementary, 21% Middle, 43% High, 2% Continuation • 233 Fast Food Outlets • 27% within 1000 ft (2 blocks) of school • 23% visible from school
Number of Fast Food w/in ½ mile of Schools • Mean of 5 fast food • Worst case scenario: 22 fast food in ½ mile
Fast Food Chains: burgers, fried chicken/fish, taco/Mexican/Latino, fast Chinese, ≥ 6 locations • Fast Food Non-Chain: same styles as Fast Food Chain, but < 6 locations • Other: deli-non chain, café, hot dog stands, more than one style, etc. FF Outlet Types
Number and Type of Ads on Doors and Windows 33% had large unhealthy ads 27% had ads on roof or walls 28% had ads elsewhere (1-2) (2-5) (3-9) (6+) Due to aggregation of variables with ranges, categories are not mutually exclusive and are used as an indicator
15% FF had ads that were “kid oriented” Child-oriented Marketing 31% Fast Food had Toys in Kids Meals Among FF with toys in kids meals
Nutrition Information & Labeling No outlets with calories on the menu board
Brochure or pamphlet of menu items near ordering counter (within 6 feet) minimum: Total calories Carbohydrates Saturated fat Sodium
Brochures/posters, often NOT near the point of purchase to inform decision making process
Implications • More evidence documenting presence of fast food around schools • Important for developing meaningful, targeted nutrition education • Critical for understanding what kids are up against outside the school walls • Can inform partnerships and policies • Shows need for initiatives to reduce fast food and marketing of fast food around schools
Next Steps for CX3 • Under Development: A school score that examines environment within ½ mile boundary of school and includes • Retail food stores • Fast food • Outdoor marketing (1000 ft) • Mobile vending (500 ft) • Walkability and safety • Food exposure scale that includes all opportunities for eating • Adding to current elements: donut shops, coffee shops, ice cream, specialty, etc. • Examine relationships with body composition of youth (FITNESSGRAM), income and school level
Thank you! Alyssa Ghirardelli, MPH, RD Research Scientist Network for a Healthy California CA Dept. of Public Health Public Health Institute Alyssa.Ghirardelli@cdph.ca.gov 916-449-5342