Download

1 / 12
120 likes | 329 Views
Wednesday November 20, 2013 Bell Ringer:. Find the x and y intercepts for the following equation: 2y + 6x = 24. What We are Learning Today:. To graph linear inequalities. What is a Linear Inequality?. Linear means that it is a straight line with a rate of change (slope)

E N D
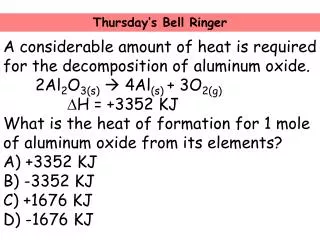
Wednesday November 20, 2013Bell Ringer: Find the x and y intercepts for the following equation: 2y + 6x = 24
What We are Learning Today: • To graph linear inequalities
What is a Linear Inequality? • Linear means that it is a straight line with a rate of change (slope) • Inequalities are equations that use >, <, ≥, ≤ instead of an = sign • We graph linear inequalities in a similar way to the way that we graph linear equations that have an = sign
Graphing Inequalities • Use the slope and y-intercept to plot two points. • Draw in the line (Boundary). • Use a solid line for (less than or equal to) or ≥ (greater than or equal to) • Use a dashed line for >(greater than), <(less than) • Pick a point above the line or below the line, the origin works nicely. Test that point in the inequality. If it makes the inequality true, then shade the region that contains that point. If the point does not make the inequality true, shade the region on the other side of the line (Half-Plane).
Let’s Work These Together:Shade the appropriate side of the graph • y < 1/3x • y ≤ 2x – 2
Let’s Work This Together: • y ≤ -2x + 3 • b = • m = • Draw the line • Solid or Dashed? • Check for shading
Let’s Work This Together: • y > ¾ x – 4 • b = • m = • Draw the line • Solid or Dashed? • Check for shading
Our Problem: • I have $30 to spend on $5 burgers or $2 tacos. How many burgers or tacos can I buy? I cannot spend more than I have! • Create a table to show the rate of change for each • Write an inequality for each • Graph each inequality
Inequalities: • Burgers: • Tacos: