Download
1 / 26
260 likes | 416 Views
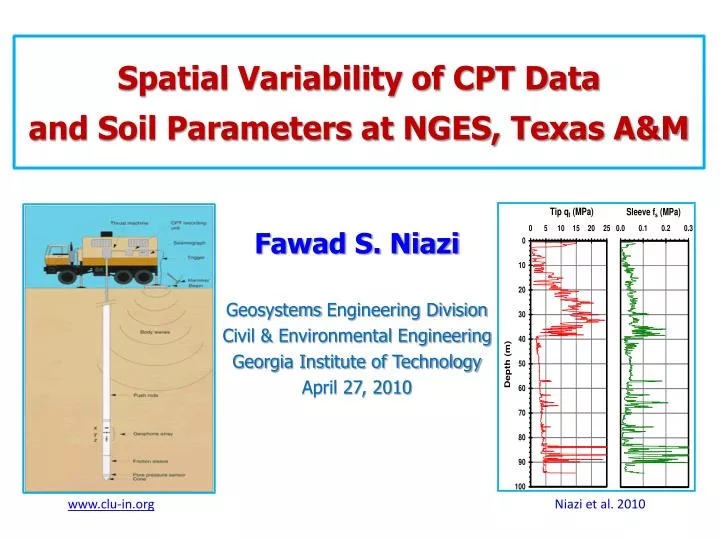
Spatial Variability of CPT Data and Soil Parameters at NGES, Texas A&M. Fawad S. Niazi Geosystems Engineering Division Civil & Environmental Engineering Georgia Institute of Technology April 27, 2010. www.clu-in.org. Niazi et al. 2010. Scope of Study.

E N D
Spatial Variability of CPT Data and Soil Parameters at NGES, Texas A&M Fawad S. Niazi Geosystems Engineering Division Civil & Environmental Engineering Georgia Institute of Technology April 27, 2010 www.clu-in.org Niazi et al. 2010
Scope of Study • Spatial variability of CPT readings for horizontal & vertical variability in soil profiles (all soundings, each10cmdepth): • Mean, min, max • Moment statistics (variance, skewness, kurtosis) • Residuals of principal comp. analysis of CPT readings (space and depth) • Test of normality (χ2 test) • Comparison of measured and evaluated soil unit weight, gt • LS regression, correlation coefficient • LS, principal component and reduced major axis regression • Higher order regression and residuals analysis
Cone Penetration Test– a Hybrid Method • Site characterization: • Conventional boring/sampling methods • Lab investigations on disturbed samples • Cone penetrationtest: • Fast, economical, and continuous data • up to 4 separate readings in one sounding • Soil parameter interpretation Vs fs u2 qc Ic, t, OCR,p', Ko, su,', DR, Gmax qc, fs, u2, Vs
Typical Cone Penetration Sounding VS fs u2 qt
National Geotechnical Experimentation Site Riverside Campus, Texas A&M University Geotechnical Experimentation Site College Station Texas A&M University
Location of Clay and Sand Sites on Riverside Campus, Texas A&M University Sand Site Clay Site
Field Investigations at NGES Clay Site, Texas A&M University N 3 13 6 14 5 4 18 15 1 8 16 17 22 7 30 28 2 19 9 29 31 15 21 33 32 10 23 24 16 20 25 11 Legend 12 26 CPT 27 CPTu MCPT SCPT 15 m BH Clay Control • Testing Program • 1977 to 1995 • Nine CPT • 1995 to 1996 • Three CPTu CPT: 10 cm2 Cone Penetration Test CPTu:Piezocone Penetration Test MCPT: 2 cm2 Mini Cone Penetration Test SCPT: 15 cm2 Seismic Piezocone Penetration Test BH: Borehole • 1997 • Twelve MCPT • Six CPT • Three SCPT
Horizontal Variability of Tip Resistance Profiles Critical χ2 Value = 11.08
Spatial Variability Trend of Tip Resistance Profiles for 33 CPT Soundings Critical χ2 Value = 11.08
Horizontal Variability of Sleeve Friction Profiles Critical χ2 Value = 11.08
Spatial Variability Trend of Sleeve Friction Profiles for 33 CPT Soundings Critical χ2 Value = 11.08
Residuals of Principal Comp. Analysis of qt at 0.16 m Critical χ2 Value = 11.08
Residuals of Principal Comp. Analysis of qt at 10.56 m Critical χ2 Value = 11.08
Residuals of Principal Comp. Analysis of Tip Resistance at CPT4 Critical χ2 Value = 11.08
Residuals of Principal Comp. Analysis of Tip Resistance at MCPT13 Critical χ2 Value = 11.08
Results of Horizontal Variability Study 0 – 1.1 m 4.9 – 8.7 m 10.5 – 13.6 m
Results of Vertical Variability Study N 3 13 6 14 5 4 18 15 1 8 16 A 17 22 7 30 28 2 19 9 29 31 15 21 33 32 10 23 A’ 24 16 20 25 11 Legend 12 26 CPT 27 CPTu MCPT SCPT 15 m BH • Testing Program • 1977 to 1995 • Nine CPT • 1995 to 1996 • Three CPTu CPT: 10 cm2 Cone Penetration Test CPTu:Piezocone Penetration Test MCPT: 2 cm2 Mini Cone Penetration Test SCPT: 15 cm2 Seismic Piezocone Penetration Test BH: Borehole Clay Control • 1997 • Twelve MCPT • Six CPT • Three SCPT
Correlations: CPT Readings and Soil Unit Weight, gt Mayne et al. 2010 • gt = Total unit weight (kN/m3) • gw = Unit weight of water (kN/m3) • qt= Cone tip resistance (kPa) • fs= Sleeve friction (kPa) • z = Depth (m) • svo’ = Effective vertical overburden stress (kPa) • satm = Atmospheric pressure (kPa)
Least Square Regression, Correlation Coefficient, 95% Confidence Bounds r = -0.2999 r = -0.2508
Results of Vertical Variability Study N 3 13 6 14 5 4 18 15 1 8 16 17 22 7 30 28 2 19 9 29 31 15 21 33 32 10 23 24 16 20 25 11 Legend 12 26 CPT 27 CPTu MCPT SCPT 15 m BH • Testing Program • 1977 to 1995 • Nine CPT • 1995 to 1996 • Three CPTu CPT: 10 cm2 Cone Penetration Test CPTu:Piezocone Penetration Test MCPT: 2 cm2 Mini Cone Penetration Test SCPT: 15 cm2 Seismic Piezocone Penetration Test BH: Borehole Clay Control • 1997 • Twelve MCPT • Six CPT • Three SCPT
Least Square Regression, Correlation Coefficient, 95% Confidence Bounds p = 0.0001 p = 0.0002
Least Squares, Principal Component And Reduced Major Axis Regression Analyses
Conclusions • Horizontal and vertical variability of CPT readings for better site characterization • CPT-based relationship for evaluating soil unit weight Mayne et al. 2010
Spatial Variability of CPT Data and Soil Parameters at NGES, Texas A&M Fawad S. Niazi Geosystems Engineering Division Civil & Environmental Engineering Georgia Institute of Technology April 27, 2010 www.clu-in.org Niazi et al. 2010